When I was in high school, my high school quarterly report card always told me which decile I was in with respect to grades.
Every quarter – top 10%, 2nd half.
There were 495 students in my grade so that meant I was somewhere between 25th and 50th.
Every quarter – same result. Top 10%, 2nd half.
Was that good? Compared to 90%, yes. Compared to 5%, no.
Now that I’m easing into my late-30’s, I realize that the rankings have largely disappeared but the comparisons remain.
🗓️ I updated this post with the latest U.S. Census data from 2022, reported in June 2023, so all the tables have the most currently available data. The visual charts still need to be updated, they are using older 2011 data, but the general trends are still correct.
I use median and average interchangeably. I recognize the two are not the same but for most people, they want to know the median even if they ask for the average. We always, technically, use median even when we use the word average.
Much like your GPA in high school, if you were to point to one figure in your life that summed up how you were doing – it’s probably your net worth.
It’s really easy to see the people around you with new clothes, fancy cars, and enormous houses and think they’re wealthy.
It’s just as easy to overlook the janitor who drove a 2007 Toyota Yaris, kept his clothes together with safety pins and foraged for firewood. He’s definitely poor… right?
But that ex-janitor donated six million to a local library and hospital.
Most of us are somewhere in-between.
Fortunately, the U.S. Census Bureau collects valuable data that can help give us guidance. With hard data.
Table of Contents
- Understanding Average Net Worth Data Sources
- ⭐Median Net Worth of All Americans⭐
- Median Value of Assets by Generation
- Median Value of Assets by Education
- Median Value of Assets for Households by Age and Type
- Median Income by Age
- Ratio of Median Net Worth to Income by Age
- Net Worth with and without Home Equity
- Number of Accredited Investors
- My Personal Takeaways
- How do the rich get richer?
- How You Can Increase Your Net Worth
Understanding Average Net Worth Data Sources
The U.S. Census does more than count the number of people in the U.S. – they collect a lot of other data too.
We know the net worth of householders based on a variety of factors – including age. The data shown below was taken from the U.S. Census Bureau, Survey of Income and Program Participation (SIPP), Survey Year 2022 – released 6/27/2023. That’s a lot of dates but the data is solid and the most up to date as of March 2024.
If you go to the 2022 SIPP website page, they state “The 2022 SIPP continued to face data collection complications because of increasing costs and a general lower-than-average unit response rate nationally.” It’s unclear when we’ll get more up to date data.
Figures of net worth include home equity (it’s not clear how home equity is determined though).
⭐Median Net Worth of All Americans⭐
The median net worth for all Americans across all demographic categories is $166,900.
If you exclude home equity, the average net worth is $57,890.
As for average net worth with and without equity, broken down by age:
| Age of Householder | Median Net Worth | Median Net Worth excluding Home Equity |
|---|---|---|
| Under 35: | $30,500 | $18,270 |
| 35 – 44 | $126,900 | $49,000 |
| 45 – 54: | $186,000 | $70,910 |
| 55 – 64: | $276,000 | $106,900 |
| 65 – 69: | $341,400 | $138,100 |
| 70 – 74: | $373,900 | $146,900 |
| 65+: | $336,000 | $117,700 |
| 75+: | $315,900 | $92,300 |
| All: | $166,900 | $57,890 |
But that’s the high level number – we can dig deeper and learn more.
| Age of Householder | Median Net Worth |
|---|---|
| Under 35 years old: | $22,000 |
| 35 to 44 years old: | $97,740 |
| 45 to 54 years old: | $166,600 |
| 55 to 64 years old: | $230,900 |
| 65 to 69 years old: | $285,100 |
| 70 to 74 years old: | $326,700 |
| 65+ years old: | $300,000 |
| 75+ years old: | $292,800 |
Here it is in chart form with quintiles (this is with older 2011 data but still close enough visually):
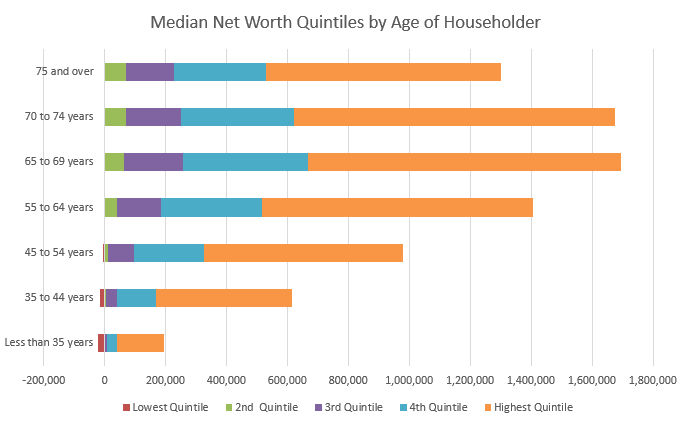
The highest quintile, which represents the top 20%, is often the biggest jump in median net worth for a quintile. Remember, these are median values so the top 10% are literally off the charts.
Without running a regression analysis, I suspect the biggest impact on net worth is going to be age. The older you are, the longer you’ve been earning and thus accumulating assets. That said, it’s still educational to look at comparisons across different factors like education.
Median Value of Assets by Generation
Want to start a fight? Here’s how the net worths compare by generation:
- Generation Z – $8,870 ($7,500 when excluding net worth)
- Millennial – $58,430 ($28,760 when excluding net worth)
- Generation X – $180,600 ($69,140 when excluding net worth)
- Baby Boomer – $321,000 ($127,300 when excluding net worth)
- Silent Generation – $308,600 ($86,300 when excluding net worth)
Median Value of Assets by Education
As for net worth based on the highest level of educational attainment, it follows the trends you may expect:
- No high school diploma – $8,460 ($3,120 when excluding net worth)
- High school graduate only – $55,030 ($16,140 when excluding net worth)
- Some college, no degree – $90,810 ($30,140 when excluding net worth)
- Associate’s degree – $139,000 ($44,800 when excluding net worth)
- Bachelor’s degree – $266,600 ($121,700 when excluding net worth)
- Graduate or professional degree – $555,900 ($321,700 when excluding net worth)
Median Value of Assets for Households by Age and Type
| Age of Householder | Married-couple | Male householder | Female householder |
|---|---|---|---|
| Under 35: | $86,430 | $27,620 | $9,390 |
| 35 – 54 | $304,600 | $81,240 | $28,600 |
| 55 – 64: | $571,900 | $103,000 | $98,300 |
| 65+: | $600,000 | $197,900 | $184,000 |
| All: | $370,000 | $69,400 | $58,240 |
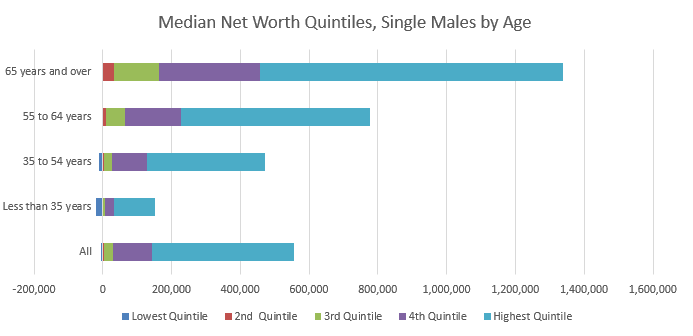
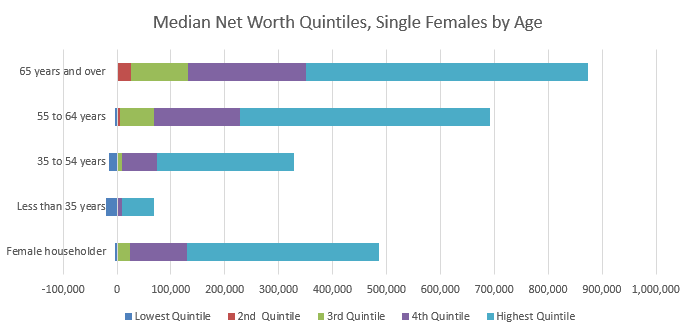
Here these are in chart form (note: the X-axis scales are different!):
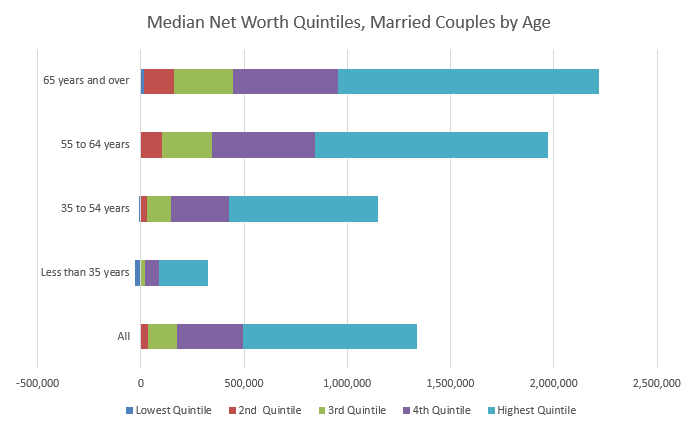
Overall, independent of age, the median net worth by average household income quintile was:
- Lowest quintile – $12,000
- Second quintile – $61,260
- Third quintile – $145,200
- Fourth quintile – $269,100
- Highest quintile – $805,400
Median Income by Age
Before we start looking at the numbers and drawing conclusions, net worth is as much as inputs (income) as it is about outputs (expenses).
For income, there are several data sources but I’m going to go with the Federal Reserve (BLS has great data too) and their Survey of Consumer Finances report for 2022 (released in 2023):
| Age of Householder | Median Income (estimate) |
|---|---|
| Less than 35 | $60,500 |
| 35 – 44 | $85,900 |
| 45 – 54 | $91,900 |
| 55 – 64 | $81,900 |
| 65 – 74 | $60,900 |
| 75+ | $49,100 |
Ratio of Median Net Worth to Income by Age
The SCF also has net worth data so we can calculate the ratio of net worth to income:
| Age of Householder | Ratio (Net Worth / Income) |
|---|---|
| Less than 35: | 0.645 |
| 35 – 44 | 1.579 |
| 45 – 54: | 2,690 |
| 55 – 64: | 4.451 |
| 65 – 74 | 6.731 |
| 75+: | 6.835 |
Interesting huh?
Net Worth with and without Home Equity
Here’s something very eye-opening from the Census data:
| Age of Householder | Median Net Worth | Median Net Worth excluding Home Equity |
|---|---|---|
| Under 35: | $30,500 | $18,270 |
| 35 – 44 | $126,900 | $49,000 |
| 45 – 54: | $186,000 | $70,910 |
| 55 – 64: | $276,000 | $106,900 |
| 65 – 69: | $341,400 | $138,100 |
| 70 – 74: | $373,900 | $146,900 |
| 65+: | $336,000 | $117,700 |
| 75+: | $315,900 | $92,300 |
| All: | $166,900 | $57,890 |
Ponder the differences in those columns, especially as you reach higher ages. One caveat is that they’re both median figures, so the person with a net worth of $30,500 isn’t the same person as the one with a median net worth excluding home equity of $18,270 – but this is good enough for our purposes of identifying trends.
As a percentage of total net worth, here’s how home equity stacks up in each age group:
| Age of Householder | Home Equity | % of Total |
|---|---|---|
| Under 35: | $12,230 | 40% |
| 35 – 44 | $77,900 | 61% |
| 45 – 54: | $115,090 | 62% |
| 55 – 64: | $169,100 | 61% |
| 65 – 69: | $203,300 | 60% |
| 70 – 74: | $227,000 | 61% |
| 65+: | $218,300 | 65% |
| 75+: | $223,600 | 71% |
| All | $109,010 | 65% |
The median net worth of all Americans is $166,900. The median net worth excluding equity is $57,890 – which means home equity (of $109,010) accounts for 65% of total net worth.
I have only one thing to say about that – that’s incredible!
When they say that real estate is a way to build wealth, this isn’t what they mean!
My guess is that home equity is essentially “forced savings,” which may not be mathematically optimal but it is effective.
Number of Accredited Investors
An accredited investor is someone who has a net worth greater than $1,000,000 or has income greater than $200,000 a year for each of the last two years ($300,000 of combined income for those who are married) and expects to make that much this year.
In 2014, at the Forum on Small Business Capital Formation, the SEC held a discussion about the rules for accredited investors. In this presentation, they showed that there were over 9 million households that would qualify based on net worth alone. If you include income rules, that number increases to over 12 million households.
This is important because accredited investors can take advantage of private placements, angel investments and some crowfunded real estate platforms.
My Personal Takeaways
We only looked at median net worth, income, and a few other demographic factors. We skipped a lot of factors, like geography, education, and many many more. You cannot look at these numbers and feel good or bad about where you are specifically.
These groupings are huge – 10 year periods – and net worth doesn’t even start until 35. The lowest income range starts at 15! I made nothing (reported to the IRS!) when I was 15 and was working a full-time job when I was 23. That age range is hardly homogenous.
I recognize this is imperfect but so is making decisions based on what everyone else is doing. Remember that this data is a view of American’s net worth, their income, etc. It’s not meant to paint the picture of an ideal financial situation. The average credit card debt is still five figures and no one is arguing that’s a good thing!
With that out of the way, is there anything interesting to tease out of this?
- We tend to reach “peak net worth” in our early 70’s, otherwise known as the first few years after our typical retirement age. Then we draw upon those assets because we stop working full-time. It’s also when Social Security starts paying and that’s an income stream not represented in your net worth.
- We are woefully unprepared for retirement. If you have a net worth of $336,000 when you hit 65 and expect to spend only 4% a year, that gives you $13,400 a year or less than $1116 a month (and that’s based on net worth, not cash in the bank). Even with the average monthly Social Security benefit at $1341 (2016 data), that’s a little over $2,400 a month in retirement income. That’s the median. Half get more, half get less.
- In the past I’ve talked about financial gravity, you escape it when your passive income exceeds your expenses so it becomes an ever-growing balance. When you’re young with low-income relative to expenses, it’s hard to save. It’s why the net worth ratio for those under 35 is so low – you’ve had neither the time nor the income to accumulate assets. Compare that to 55+, when the ratio is 2-4x.
- If you save money, invest it wisely, then you will surely beat the average. In fact, the average is going to be too low. It will be misleadingly low. In fact, just investing at all will put you ahead of most Americans because very few of them own stock at all!
- Lastly, net worth is a valuable financial benchmark, but remember it’s not everything.
How do the rich get richer?
One of the striking stats is how uneven wealth is in America. It’s shocking how low the median net worth is but also how high the top end of the range is.
For more insight on the distribution of wealth, and how we got to where we are today, I posed a few questions to Professor Rishabh Kumar, Assistant Professor of Economics at California State University, San Bernardino – he has been studying this for many years:

Q. When we look at the distribution of wealth in America, what are the biggest drivers of wealth accumulation?
The main reason appears to be slower national income growth in the US along with a long upswing in asset prices. With low growth, even a small asset price appreciation can increase the size of wealth relative to national income.
If asset prices increase by 2% in real terms while income grows at 2%, the effect is larger than (say) 4-5% national income growth (USA 1945-70). The implication is that asset owners become richer as GDP and national income slow down.
Q. What do the top 1% do differently than the rest of Americans?
One of the key differences is that the top 1% is a much more unequal growth than (say) the top 10-1%. At the level of the top 0.1%, the size of wealth is enormous, nearly 3 times the average wealth in the top 1%. This means returns to wealth are exceptionally large for the richest 0.1%.
Compared to their wealth and capital gains, their spending is almost too small to be noticed. For most Americans, savings are closer to 0-2% of their income while for the richest the saving rate is as high as 60%.
Not only are the rich holding sizeable wealth but they save more of their income too.
Q. What are some common misconceptions of how the wealth get where they are?
The most common misconception is the fraction of meritocratic rich in the US. While many such as Gates and Zuckerberg have made outstanding gains due to their entrepreneurship, the average wealthy family tends to inherit their position. There is very little chance of downward social mobility once an American is in the top 0.5-0.1%.
With access to better schooling, influential networks, and a sizeable inheritance, kids from these families are able to dedicate themselves to increasing their dynastic wealth as opposed to building it up from scratch.
To sum up: the core driver of wealth accumulation in USA is the difference between the growth of asset prices vs income; those who already own wealth grow it faster than those who build new wealth from wages and salaries.
This makes intuitive sense but it’s one thing to think it and another to see it in the data.
How You Can Increase Your Net Worth
I started tracking my net worth when I started working – the perils of being a spreadsheet junkie!
There’s also a trend, especially among personal finance bloggers, of sharing net worth reports with your audience. I’m never going to do that but sometimes I think those net worth reports can lead people to the wrong conclusions. It’s about the journey and the trendline, not the headline number.
Peter Drucker, the famed management consultant, once said that “What gets measured gets improved.” While the simple act of tracking your net worth won’t automatically raise it, it will start impacting your behavior. If you check in on your money every month, you’ll start caring if things go up or down.


does that include all assets including your house? Seems low
It does include the equity in your house, the figures excluding it are even lower.
There’s been a lot of talk about how older generations are “being screwed” because younger generations aren’t buying homes. So the folks who relied on their house as a retirement vehicle are now finding it hard to cash out, or cash out at levels they expected. It’s quite a conundrum.
Alternatively, I see a shift where there is insufficient inventory of existing homes for younger folks to buy as the mid-range to older millennials are in their 30s. Regarding retirees, we in fact may be witnessing more of a “choice” versus a “screwing” as many boomers plan to stay put in their homes in retirement.
http://money.cnn.com/2014/10/30/real_estate/baby-boomers-homes/index.html
Builders are just now starting to build more affordable first homes, but they are typically in the metro outer belts, far from where the younger crowd wants to live.
The difference between choice and screwing is all about perspective and emotional involvement. 🙂
But your point is well taken and I agree, the data does show that. The financial crisis and subsequent recession delayed a lot of activities across the board, which is something that needs to be managed. If people are working longer, staying in their homes longer, then the younger generation has to wait until that process works itself out sometimes.
Both of you are kind of wrong on the housing haven’t you ever watched the movie “It’s a wonderful life”?. The problem in housing is that historically the “starter homes” were the large, expensive-to-heat, drafty old places that Grandma had lived in for 40 years and died in and not put a dime into, and had rotting roofs, rusted out plumbing, and electrical that was 2 sparks away from burning the place to the ground. The youngsters would buy them cheap and put 3-4 years of hard work sweat equity into and get them fixed up. (as the movie detailed)… Read more »
Doesn’t seem low to me. This says the median income of a 40 year old is 71,000. I know exactly two people that age who make over 71,000. I know dozens who make between 16,000 and 40,000. I wonder what the distribution looks like. It’s hard for me to believe. At my lab company there is a manager who makes like 50k. And a boss above him who makes like 170k. But then there are like 60 people at the bottom actually doing the microscope work of diagnosing cancers who make like 27k-40k. I am betting there is a huge… Read more »
I think that most educated individuals with a strong work ethic and goals can meet 70k by midlife. You may have to get another degree or work for yourself. Everyone I know has achieved that number already, in their 30’s.
I just turned 58. Not educated, have been a Word Processor for 30 years at consulting companies. I worked hard, and started my retirement savings at 38. My net worth between my 401k and the equity in my home is about $450,000 after taxes. I purchased my home for $119,000 in 2000. It’s just a matter of set it and forget it! Start the 401k before 40; contribute 15% of salary, and forget about it for 20 years, and buy a home, any home before you are 40, stay in it awhile – you’ll get some decent equity in it… Read more »
Thanks for the really useful data and analysis! We’re in the Top Quintile for 55 to 64 year old married couples which feels pretty good. I retired at 52 by being frugal and investing well. Unfortunately, I agree with you – most people are woefully unprepared for retirement. I have family that have saved nothing, zero, nada, zip for retirement. I’m worried what is going to happen to them. I know others that save, but pay so little attention into investing, it will take them much longer to become financially independent than necessary. They will be alright in the long-run,… Read more »
Unfortunately, there’s nothing you can do – people have to come to those realizations for themselves or they’ll get defensive if you bring it up (as I’m sure you know).
It’s definitely hard to watch.
The sad thing is that the realization will come too late. So many continue to consume excessively, often supported by debt, through their 50s and into their 60s, living an unsustainable lifestyle. Many are about to face a retirement reckoning that is unfathomable as their standard of living unravels as their ability to generate income diminishes. Throngs of people working well beyond normal retirement age may also tend to “constipate” the job markets, stagnating opportunities for following generations. Kudos to Mr. Freaky and others who had the wisdom to save and live within their means. I’m nearly 52 and plan… Read more »
It will be interesting to see what happens with the older generation and those who are unable to maintain the unsustainable lifestyle. After a certain point, the loans won’t come because it’s too close to EOL and there are no assets to claim from the estate to repay the loans. In theory (at least explicitely), your age is not a factor in your credit score (it is in the sense that you have a longer history, but is too long a history a bad thing?). I haven’t studied this extensively but my feeling is that credit cards haven’t been around… Read more »
Siblings with similar education and careers may have quite different retirement incomes, depending on their respective financial decisions. This can cause a lot of friction in families.
Every financial institution has guidelines for investing; it’s hard to imagine not being prepared. But what blind-sided me was the envy that surfaced in my family as we entered middle age.
I really enjoyed this analysis (and the “third person” joke that I’m going to steal) but I do wish financial advisors talked more about the results of creating a large net-worth.
Anytime you add 40 years, a lot of things can happen even if the inputs are largely the same. 🙂
Thank goodness the economy continues to slowly improve, because it looks like a lot of people will have to work long into their golden years. Or starve. But working seems like a better option, haha.
Thanks for the great data and graphs!
Working is better. 🙂
Has it always been this way? I feel like understanding where were 10, 20, or 30 years ago would really help put this into context. It’s hard to know if this is a looming problem that is about to blow up in our faces or just the way things are? Jim, have you ever stumbled across any historical data similar to this that has been inflation adjusted?
I have a feeling that 20 or 30 years ago, retirees had more Defined Benefit Plans aka pensions.
Good point, those don’t show up on people’s balance sheets. I still wonder if they were accounted for in any way.
My gut says that’s the case too because the 401(k) was made possible in 1978 when Congress passed the Revenue Act of 1978. They’d become more popular a little later but before that you had only defined benefit plans. If you have a pension, much like Social Security, then you have a stream of income coming that isn’t tied to an asset you own. You could go through the act of valuing the cash flow (like net present value, estimating your lifespan) but that’s not something an individual will likely do (and thus likely report to the Census when asked).
The farthest back the Census goes on this (online) is 1991, from their 1993 report. Median net worth in 1991, adjusted for 2017 dollars, is $48,870.50. Our 2011 median net worth of $68,828 expressed in 2017 dollars is a more impressive $76,422.98. So median net worth has improved slightly each year.
(The report gives the median net worth in 1991 but expressed in 1993 dollars. I used the BLS Inflation calculator and turned those January 1993 dollars into April 2017 dollars.)
The roughly $28K increase (in 2017 dollars) includes a wider use of 401(K) investments, which are included in net worth, versus the higher use of pensions in 1993, which are not part of one’s net worth.
So the increase of the net worth number may not show any evidence of behavioral change relative to preparing for retirement during the 20 years period in question. The numbers provided can not show whether people are better financially positioned in 2011or in 1991.
W00t! Top quintile for Under 35, despite my negative equity in my home! Or course I’m also at the top end of that age range, so I will be in the 35-44 group by EOY.
GET TO WORK THEN! 🙂
We have a huge and growing wealth gap in the US, with 1% of the population owning 43% of the wealth in 2011 (Wikipedia).
So, what happens if we take the uber-wealthy top 3 -8 % out of the average for these numbers? We have a nation of broke people thinking they’re wealthy because of their shiny new cars and other debt shackles.
That’s where financial education and awareness come in-thanks for the great work you do in this, Jim!
Well, that’s why we use median rather than average. If there are ten people in the room and one of them is Bill Gates, the average person is a billionaire. 🙂
With median, it’s at least closer to the “middle.”
That said, there is still a wealth gap but the concentration is accounted for when using median.
Financial education is crucial because the ying to its yang, marketing, churns out new graduates by the tens, if not hundreds, of thousands each year!
Pray tell then why do you use “average” in one of your paragraph headings :
“Understanding Average Net Worth
The U.S. Census does more than count the number of people in the U.S. – they collect a lot of other data too.” (above)
when the tables following are median numbers which are the ‘correct’ ones to use. Adding to the confusion of these two very different numbers is not helpful.
Fair question – the two terms are very different but oftentimes when someone is looking for average, they mean median. They assume some kind of binomial distribution of income, even though there’s no reason, and I’m assuming that bias and using the term average.
Median is a form of average. You two are using the word average to only mean mean.
I am starting to see more and more age descrimination of people in their 50s. This will make it harder and harder to catch up. Especially in the technology space.
Also, more 500k+ houses are being built near me. Some are over 650k. Talk about a waste of money. But they are selling.
The data for Under 35s (my age group) seems particularly depressing. The rising cost of living combined with wage stagnation makes me very wary of the future. I feel like the middle class is slowly being eroded.
What you are doing is great if that’s all you can do. One quick thought, my wife and I amassed 70% of our retirement savings after turning 50/47. Our kids were starting to get established, thus freeing needed cash flow to channel to tax deferred 401Ks and after-tax savings. I note this because what you are currently doing is ahead of most. In turn, you’ll hopefully have more money and options for savings as you progress towards your retirement.
While a good portion of my net worth is tied up in my house, I’m currently growing my investment and business accounts month by month. Depending on the valuation, my house equity makes up 25-60k of my net worth, while my investments total about 30k.
At 25, I’m doing alright, but am excited to keep the ball rolling! Onwards and upwards
@Eric
I’m 62, closing in on retirement. I have no advice for you as you seem to be doing things right. But I just wanted to say that when I was your age (oh how I hate those words…), I was suspicious of the math that showed I could retire wealthy, early. Even with the numbers in front of me, I just wasn’t convinced that someone with a moderate salary could become wealthy.
I’m here to tell you that it works! Nobody is as suprised as me, but it does work and you’ll get there. Just keep going!
Shows how much people are relying on their homes for retirement. As you mentioned the liquid assets of many are small while home equity is rather large. This is why the reverse mortgage industry continues to make money, people can use their home as an ATM. Pretty sobering numbers but life goes on for the majority of people in the lower quintile. I feel like finance blogs are always on another level while the reality is many people either don’t care or feel helpless and would rather enjoy today. If you start early and focus you can become very wealthy… Read more »
Damn, I agree.
If you combine a natural tendency to procrastinate with a poor understanding of compounded interest, I think you end up with a lot of apathy and financial fatalism, so people just stop trying. And since they’re in good company, they figure “somebody will fix this”.
What scares me is when those people are in your family. So prepare yourself – If you save and do everything right, you’ll retire wealthy. But you may find siblings and friends are very envious.
Tom,
Good point on the family and friends observation. I think this makes people wonder why they are working/saving in the first place if it will ultimately make them an outsider to those they care about the most…makes the case for stealth wealth which I am a big fan of.
I’m concerned by the possibility/probability that all of that “good company” will vote for someone to “fix this”…someone akin to Bernie. Whether because of apathy, poor choices in life or bad luck, so many seem to adopt the perspective of the victim these days. And, in their minds, to be a victim, there must be an oppressor; oppressors may be family members or people they perceive to have wealth. And DM, I as well am a big fan of stealth wealth…under the radar!
Larry no control over what government policy is so I don’t even focus on that piece. I do agree with you on a large victim mentality. Only one way to get what you want and that’s to rise up and get it with your own hard work and dedication. I have never seen anyone get rewarded for complaining no one else will listen or care.