How much do you have saved up in retirement?
If you’re like most Americans, the answer is not much. The average net worth of Americans is just $118,200. When you take out home equity, it’s only $41,200.
That’s across the entire population of the United States – single, married, 65, 25, black, white, etc.
Do you know what the median balance in a 401K is?
Just $50,000.
If you’re age 35 and under, the median is a mere $15,000.
Financial media will have you thinking you need to invest in the hottest investment like bitcoin and cryptocurrencies, or real estate that always appreciates, or maybe just straight up gold bullion.
Nope. It’s all about savings.
We just don’t save enough. Save money, invest in boring index funds, wait, and prosper.
What if you are doing that and you want to know how you compare to your peer group? That’s easy – we have tons of data to show you how well you’re doing. Or if you’ve fallen behind. Either way, it should give you confidence that you’re making the right decisions.
For this, we will have to look at some data:
Table of Contents
More recently, we looked at government data to ascertain the average retirement income, which was an interesting exercise!
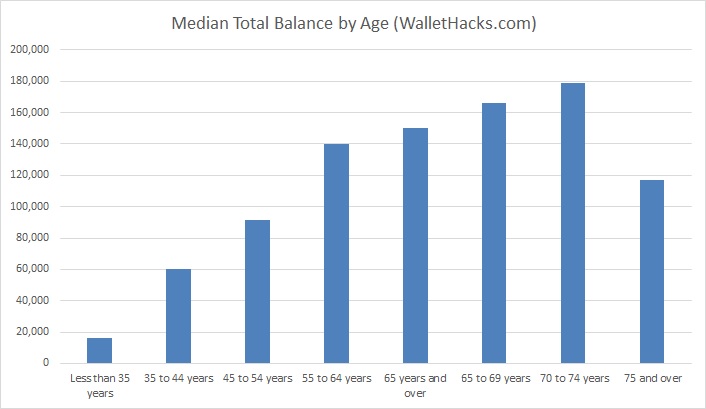
Median Value of Assets in Retirement Accounts
If we want to know the average 401(k) savings by age, we can look to Census data. When we say “average,” we (and what matters most to people) specifically refer to the term median. The middle of the pack, not necessarily the average… as they say, Bill Gates can turn a room of paupers into average millionaires.
For data, we rely on the U.S. Census Wealth, Asset Ownership, & Debt of Households Detailed Tables from 2020, the most recent year they’ve released information about retirement savings.
| Age | Median Total |
|---|---|
| All Ages | $75,000 |
| < 35 years old | $16,450 |
| 35 to 44 years old: | $60,000 |
| 45 to 54 years old: | $91,500 |
| 55 to 64 years old: | $140,000 |
| 65 to 69 years old: | $166,000 |
| 70 to 74 years old: | $178,900 |
| 65+ years old: | $150,000 |
| 75+ years old: | $117,000 |
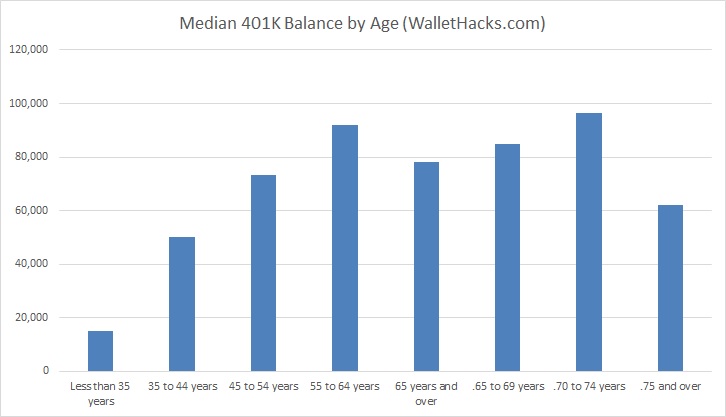
They break the data up into three groups – deferred contribution plans like a 401(k), tax-deferred plans like an IRA, and then the total.
401K & Thrift Savings Plan by Age of Householder
The Thrift Savings Plan is a 401(k)-like defined contribution plan for government employees.
| Age | Median Balance |
|---|---|
| < 35 years old | $15,000 |
| 35 to 44 years old: | $50,000 |
| 45 to 54 years old: | $73,200 |
| 55 to 64 years old: | $92,000 |
| 65 to 69 years old: | $84,800 |
| 70 to 74 years old: | $96,500 |
| 65+ years old: | $78,000 |
| 75+ years old: | $62,000 |
IRA or KEOGH Accounts by Age of Householder
A KEOGH (HR-10) plan is a tax-deferred pension plan available for self-employed persons.
| Age | Median Balance |
|---|---|
| < 35 years old | $10,000 |
| 35 to 44 years old: | $30,000 |
| 45 to 54 years old: | $50,500 |
| 55 to 64 years old: | $100,000 |
| 65 to 69 years old: | $146,600 |
| 70 to 74 years old: | $148,000 |
| 65+ years old: | $127,000 |
| 75+ years old: | $100,000 |
The U.S. Census data from 2020 are for all households. What if we took a smaller slice, those households with assets at Vanguard, to see how things change?
Data from Vanguard on Defined Contribution Plans
Vanguard publishes a How America Saves report each year and the 2022 edition, which looks at the year 2021.
For 2022, the median balance was $35,345. The average account balance was $141,542. (Page 6)
This was broken down in a few interesting ways on page 49:
| Age | Average Balance | Median Balance |
|---|---|---|
| All | $141,542 | $35,345 |
| < 25 years old | $6,264 | $1,786 |
| 25 to 34 years old: | $37,211 | $14,068 |
| 35 to 44 years old: | $97,020 | $36,117 |
| 45 to 54 years old: | $179,200 | $61,530 |
| 55 to 64 years old: | $256,244 | $89,716 |
| 65+ years old: | $279,997 | $87,725 |
| Job Tenure (years) | Average Balance | Median Balance |
|---|---|---|
| 0-1 | $16,047 | $2,657 |
| 2-3 | $42,964 | $17,067 |
| 4-6 | $74,143 | $36,130 |
| 7-9 | $119,673 | $64,411 |
| 10+ | $303,138 | $150,912 |
Data from Fidelity Investments
The most recent data we have for Fidelity includes the 4th quarter of 2017.
They discovered that IRA and 401(k) accounts are hitting record levels and people are contributing more (good!) but averages are still relatively low:
| Quarter | Average Balance 401(k) | Average Balance IRA |
|---|---|---|
| Q4 2017 | $104,300 | $106,000 |
| Q3 2017 | $99,900 | $103,500 |
| Q4 2016 | $92,500 | $93,700 |
| Q4 2012 | $77,600 | $76,600 |
What’s interesting about their data is that they’ve analyzed some trends too. For example, long term savers saw significant increases.
Workers who have been contributing to a 401(k) for 10 consecutive years saw their average balance increase to $286,700, up from $233,900 a year earlier.
For 15-year savers, the average increased to $387,100, up from $318,500 a year earlier.
Am I Doing Well Or Not?
The reality is that, in general, we do not save enough money period. I spoke with Dr. Michael Guillemette, Assistant Professor for Personal Financial Planning at Texas Tech University, about this phenomenon.

It’s difficult for retirees to know how long they are going to live. Average life expectancy is flawed since no one is really average. Wealthier people tend to live longer than average so they need to save more (as do women and non-smokers).
Social Security retirement benefits are expected to decrease by approximately 25% by the early 2030’s if Congress doesn’t act. If this happens people will need more retirement savings in place to make up the difference.
Stock and bond returns are likely to be lower in the future than they have been in the past (because the risk-free rate and bond yields are lower today than they have been historically). If expected rates of return fall then retirement savings needs to rise in order for retirees to reach their retirement income goals.
The savings rate, as measured by the St. Louis Fed, has been in the low to mid-single digits for quite some time. It was just 2.4% in December 2017. It has since improved to 6.0% in November 2018.
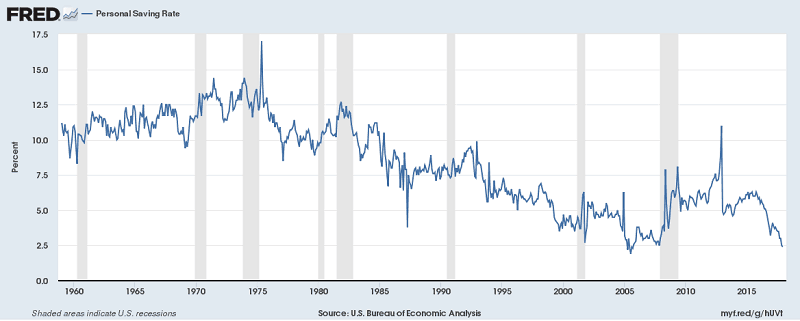
If you take the average income of Americans to be $56,516 – 2.4% of that is $1,356 a year. $113 a month.
If you save $1,356 a year for 30 years at a growth rate of 8%, do you know how much you retire with?
“Only” $180,866.
(I put “only” in quotes because $180,000 is itself a lot of money but you can’t retire on it)
This is a convoluted example, I agree. Even if you make the median income right now, it’s likely to go up as you age, learn more skills, add more value to your company, and grow as an employee. You won’t make the same wage for thirty years in a row.
That median is across all jobs, all age groups, all skills, all people. It includes people working retail at the mall as well as surgeons with decades of medical school, training, hospital experience, and malpractice insurance premiums to pay. It includes people in high school and partners at white-shoe law firms. It’s deceptive.
But I wanted to illustrate a point. If you were median everything for your entire life, which sounds bad but isn’t at all, you would retire with just $180,000 in savings.
(As it turns out, the average net worth of someone in their 60s is only slightly higher – $193,833)
What if you saved 5% of your income? If you saved $2825.80 a year or $235 a month…
… you’d retire with $376,434.
Finally, if you can save 10% of your income ($5651.60/yr), you’d retire with…
… $752,869.60.
Much better!
The takeaway? Save more. Way more.
I picked the brain of Dr. Gary A. Hoover, the Chair of the Oklahoma University Economics Department, about his thoughts on retirement contributions.

Personal savings are more critical now than ever before.
Government benefits are becoming an increasingly small portion of the portfolio available to retirees.
With a shift away from pensions to 401K savings plans, having something put away is a necessity.
It is also a great hedge against the unexpected, whether it be financial or medical.
✨Related: What is the Average Retirement Income
Look At Your Savings Rate
The key to retirement isn’t the mix of investment you pick or whether you invest in the latest craze (bitcoin anyone?), it’s in your personal savings rate. It’s in the thing you can control.
Americans do not save enough. We all know this.
2.4% just won’t cut it. 5% will barely cut it if you want to retire while you can still walk a mile without taking a break.
If you want to do something to help your finances right now, increase your savings rate. A lot.


Quick question for you Jim. Do any of these ‘averages’ include Americans younger than 18? If so, doesn’t that skew the data?
I love your posts. Thanks for the great content!
It depends on the data but generally no unless that person files their own taxes. Generally under 18 means they’re claimed as a dependent so they’d appear on the household of the person filing their taxes.
I tried to find out for sure, on say the Census data, but I couldn’t find anything. The Census data, for what it’s worth, is based on a sampling of <200,000 households and then the answers were estimates.
I haven’t gotten 5% interest on pure savings in Years!