Finviz
39.50 USDStrengths
- Many free research tools for stocks and ETFs
- In-depth stock screener and heat maps
- Supports fundamental and technical research
- 30-day refund guarantee
- Backtesting available with Finviz Elite
Weaknesses
- Only covers US stocks (no OTC or ADR listings)
- Free tools don't include advanced indicators
- Portfolio tracker doesn't sync with brokerage accounts
- Free version shows ads
- No mobile app
Anyone who trades stocks and pays attention to technical analysis knows how valuable a good stock screener can be. But with dozens of stock screeners to choose from, how do you find one that’s right for you?
Finviz is a popular choice for beginner and experienced investors alike, offering features like charts, heat maps, insider trading, and portfolio tracking.
In this Finviz review, I dive into everything Finviz has to offer, including its key tools and pricing. I also share a few Finviz alternatives.
Table of Contents
What Is Finviz?
Finviz, which is short for Financial Visualizations, is an investment research site that can help you find investment ideas or dig deep into a specific ticker. You can use it for technical and fundamental analysis.
You can research the following asset types:
Finviz is one of the better free stock analysis tools because of its extensive tools that are beginner-friendly and provide a surprising amount of data that are generally behind a paywall with other platforms.
The technical research features go further than most online stock brokerages, which are great for fundamental analysis and typically offer in-depth charting too.
Finviz Features
Finviz puts multiple research tools at your disposal to help you size up potential investments and keep tabs on your current positions. Here’s a closer look at its key features.
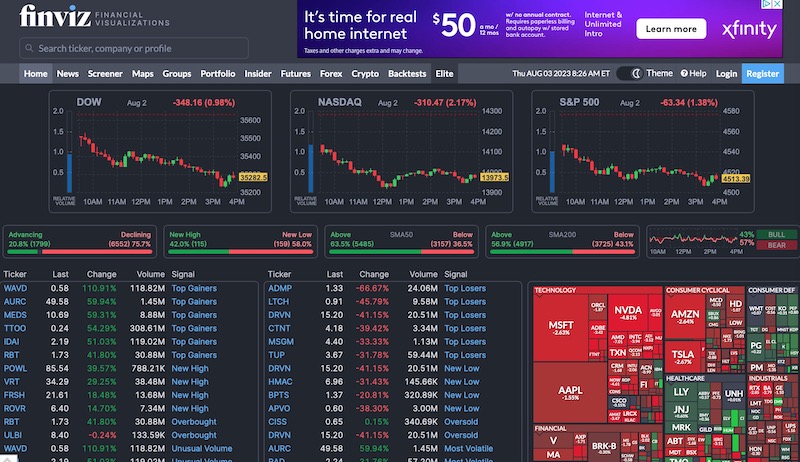
Homepage
The Finviz homepage makes it easy to digest what’s happening in the market, and is divided into the following sections:
- Current trading day performance for the S&P 500, Nasdaq, and Dow
- Top-performing and worst-performing stocks of the day
- Tickers with a trading price near a certain trading pattern (wedge, triangle)
- Headlines
- Market calendar
- Latest insider trading
- Earnings release dates
- Futures
- Forex and bonds
Other discount brokerages or advanced trading platforms may offer similar details, but with Finviz, anybody can access this information without creating an account.
The page layout is easy to understand thanks to the distinguishable categories and red or green performance indicators. Scanning the homepage can be an excellent way to keep an eye on the market and decide where you want to start researching first.
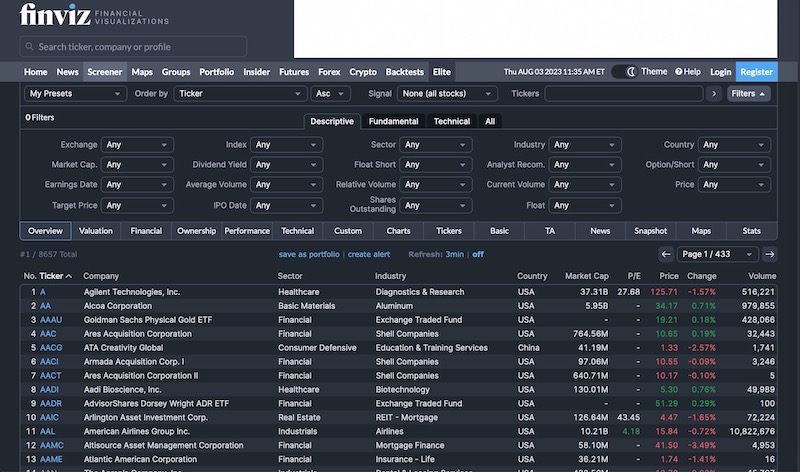
Stock Screener
Finviz’s stock screener makes it easy to compare U.S.-listed stocks and ETFs, although you cannot compare ADR and OTC stocks or commodity stocks where the common stock trades on foreign exchanges.
Despite its limitations with common stocks, Finviz has many free and premium research tools. You can screen stocks through customizable filters, including:
- Descriptive: Exchange, industry sector, dividend yield, average volume, etc.
- Fundamental: P/E ratio, price-to-sales, insider transactions, EPS growth, etc.
- Technical: Simple moving average (20-day, 50-day, 200-day), RSI, etc.
You can select filters from the descriptive, fundamental, and technical tabs to see a list of stocks matching the criteria below.
From there, you can choose different tabs to compare the stocks by various metrics, such as:
- Valuation (P/E ratio, PEG ratio, and other investment ratios)
- Financial (Dividend rate, return on equity, gross margin, profit margin)
- Ownership (Outstanding valuation, insider ownership percentage, float short)
- Performance (Investment returns for the past week, month, quarter, year)
- Technical (Simple Moving Average, RSI, price change from open, gap)
Viewing the charts, heat maps, and news headlines for screened stocks is also possible.
Charting
Many stock trading apps have impressive charting tools that let you perform technical analysis and buy stock shares on the same platform, but many overlook research tools in favor of free trades and micro-investing.
Consider charting stocks in Finviz when your go-to investing app only offers a basic historical price chart.
All users can view prices on daily, weekly, or monthly trading intervals. You can also adjust the candlestick display to your preferred setting, making it easier to spot trends.
Several basic upper and lower indicators automatically display on each chart:
- 20-day simple moving average (SMA)
- 50-day SMA
- 200-day SMA
- Volume
It’s important to note that you must upgrade to FINVIZ*Elite to overlay with over 100 technical indicators, have drawing capabilities, and view in full screen. You can also see if a paper trading simulator offers the features to test short-term strategies.
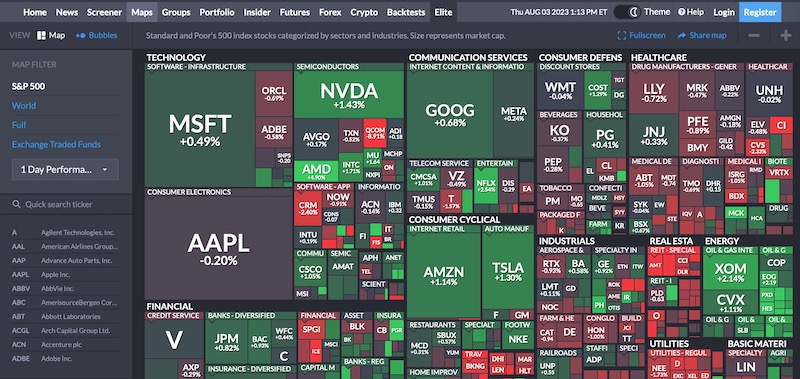
Heat Maps
The visually appealing heat maps feature lets you view the performance of individual stocks and ETFs. Companies are organized by industry (technology, communication services, healthcare, energy, railroads).
Bigger boxes indicate a larger market cap. A green shade suggests the stock trades at a higher price for the trading day, while a red hue is for lower pricing.
Extending the performance interval from one day to a year is possible. You can track year-to-date performance too.
The map can track additional metrics such as:
- P/E ratio
- Float short
- Dividend yield
- Analyst recommendations
- Earnings date
You can also filter the stock listings by S&P 500 or ETF.
The world filter displays a global map and places the stock ticker where the company headquarters are.
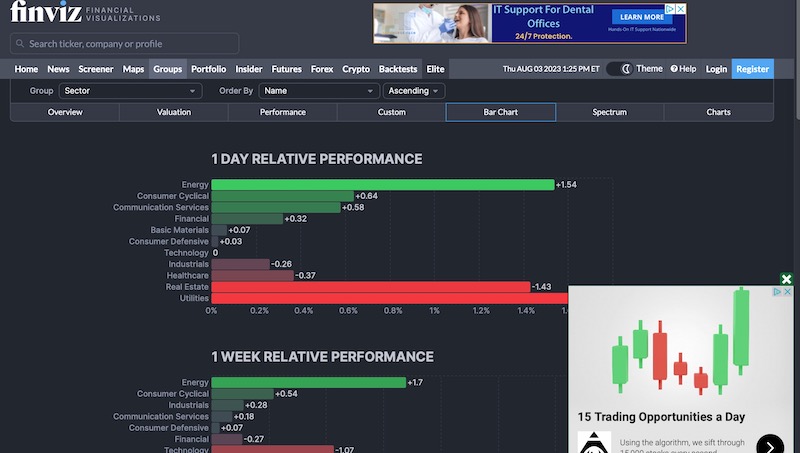
Groups
The Groups feature highlights the performance of sectors over a specific trading range. You can compare the performance of various industries, such as energy, finance, and real estate.
It’s also possible to look at the performance of subsectors within a particular industry. One example is comparing the performance of oil and gas exploration to midstream providers by selecting the Energy industry.
The color-coded bar charts make it easy to gauge the performance of a sector. Some of the graphs also break down the results by the underlying companies, which can make your research even easier.
To further explore an industry or sector, simply tap the chart row, and a separate tab opens with the screener page for the underlying stocks.
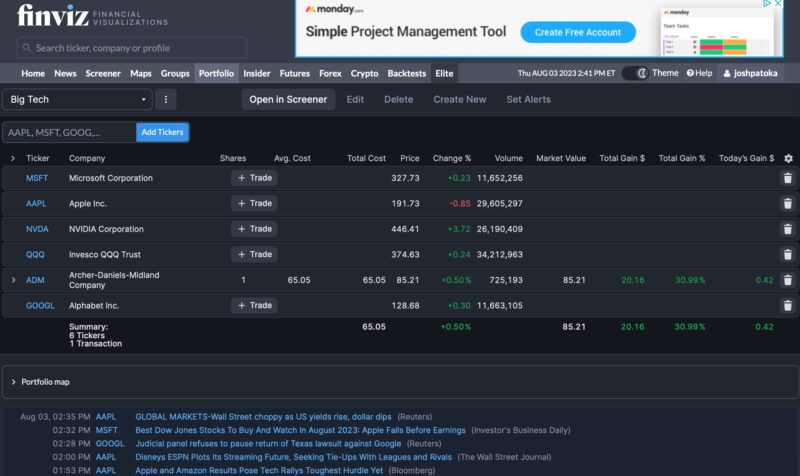
Portfolio
The Finviz portfolio tracker can help you monitor the performance of your holdings and watchlist positions.
Free accounts can make 50 different portfolios, and premium members can create up to 100. Being able to create so many lineups is a nice feature and helps personalize your user experience for research purposes.
Trackable metrics include:
- Current market value
- Total loss or gain
- Today’s performance
You can also evaluate your portfolio using interactive and portfolio-related heat maps.
One potential drawback is having to input each position detail manually. Accurate tracking means entering the acquisition date, average purchase price, and position size. Additionally, the tracking tools are relatively basic in several aspects.
Other portfolio trackers are better in this regard, as they can automatically upload your details, giving you more time to research investments.
Watchlists
Finviz recently added a watchlist feature to help you monitor potential investments within one of your Finviz portfolios.
When inspecting a stock or ETF, click “add to portfolio.” Next, you can choose “Watch” under the transaction type, with “Buy” and “Sell Short” being the other two options.
News
Many free and premium stock research services aggregate news headlines. You can see ticker-specific headlines or scan the “News” or “Blogs” columns to get a gist of what’s happening and potentially learn something new.
Many articles are free, but others hide behind the paywall or require a subscription after maxing out your monthly allotment of free articles.
You can access articles from the following outlets through Finviz:
- Bloomberg
- Fox Business
- MarketWatch
- Mish Talk
- New York Times
- Reuters
- Zerohedge
For investors who love staying on top of stock news, Finviz is one of the best ways to scan the headlines for free.
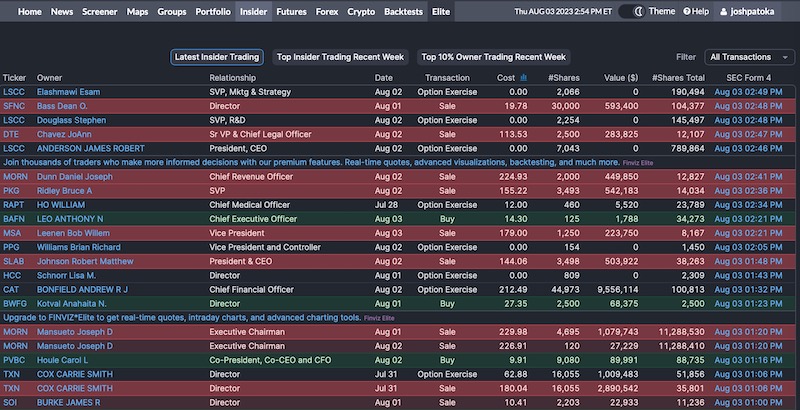
Insider Trading
If a company’s senior leadership buys or sells shares, it can indicate how the share price will trend. Corporate executives periodically sell shares and exercise options to receive monetary compensation. Still, there are times when their actions can encourage you to dig deeper in case you want to follow their lead.
These details are free to access as executives must file forms with the federal government disclosing sizable trades.
You can filter the data in the following ways:
- Latest insider trading (lists the most recent trades first)
- Top insider trading recent week (biggest trades by nominal value)
- Top 10% owner trading recent week (largest transactions from investors with a minimum 10% ownership stake)
Tracking down this data without the help of a service like Finviz can be time-consuming. You may also find that you overlook reported trades as you try to track several executives.
Futures
Investors who like to trade commodities or stock futures will find Finviz’s Futures feature helpful as you can view price quotes, performance, and charts for these investment options:
- Indices (DJIA, Nasdaq 100, Russell 2000, DAX, VIX, etc.)
- Bonds (Treasury Bonds: 2-year, 5-year, 10-year, 30-year)
- Currencies (USD, EUR, JPY, GBP, CAD, CHF, AUD, NZD)
- Energy (Brent crude oil, WTI crude oil, natural gas, gasoline)
- Grains (Corn, oats, soybeans, wheat)
- Meats (Live cattle, feeder cattle, lean hogs)
- Metals (Gold, silver, platinum, copper, palladium)
- Softs (Cocoa, coffee, cotton, lumber, orange juice, sugar)
Forex
Aggressive forex traders can retrieve the pricing for currency pairs between international currencies. You can view the price chart at intervals of five minutes, hourly, daily, weekly, monthly, and yearly.
Most comparisons measure the performance of a foreign currency to the U.S. dollar (USD). The research tools are relatively basic compared to the platform’s stock screener and heat maps, which more investors will probably use to buy long or sell short.
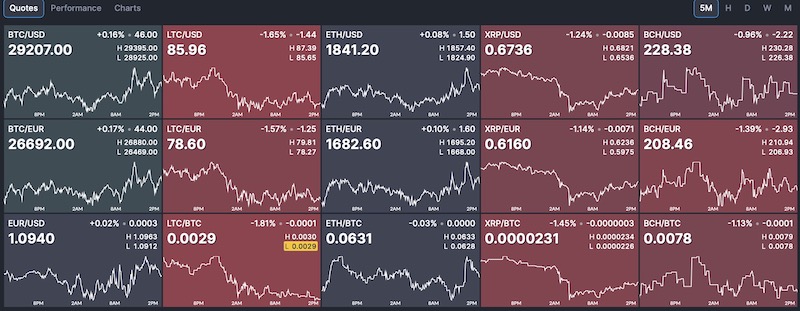
Crypto
If you dabble in cryptocurrency, you can easily see price quotes for highly traded tokens like Bitcoin, Ethereum, and Litecoin. Most quotes price the token in U.S. dollars and Euros.
Clicking on a price quote lets you view a basic price chart consisting of a 5-minute to one-year increment. Similar to stock charts, you will need to be an elite member to customize the chart display and indicators. These price quotes and charts can complement those offered by crypto portfolio trackers.
Alerts
Receive free alerts when a stock or ETF performs a specific action, such as:
- Crossing above or below a target trading price
- Fundamental or technical metrics
- Becomes overbought or oversold
- Significant insider trading
Premium members can receive alerts based on real-time data, while free users may need to rely on delayed inputs.
Backtests
Backtesting is one of the best reasons to upgrade to a paid membership. Portfolio analysis tools like Finviz can track your actual investment performance but also see how adjustments could change your historical performance.
While nobody knows how the stock market will perform in the future, backtesting lets you test your portfolio against similar market conditions so you can be prepared for more situations.
This service tests your portfolio against 24 years of historical information. You can also compare it against the SPY benchmark (S&P 500) and with 100 technical indicators.
How Much Does Finviz Cost?
Finviz offers two free plans and one paid membership tier. You may want to start with one of the free tiers to test out the platform to see if it’s worth upgrading.
Some investors will want to opt for the paid membership because of the ad-free experience, backtesting, and real-time price quotes.
Free
Anyone can use the stock screener and charting tools. You cannot save previous screens or track your portfolio, but you don’t have to provide your email address. This is uncommon, as many platforms want your contact details to market premium products.
Basic features include:
- Delayed quotes, charting, and streaming
- Maps and Groups are delayed 3 to 5 minutes.
- Three years’ access to statements
- Screener rows per page (20 tables/36 charts/10 snapshots)
Registered
Registering for a free account lets you save presets, track portfolio positions, and make basic customizations.
In addition to the Free tier features, you also get these perks:
- Portfolios: Up to 50 per user
- Tickers: Up to 50 per portfolio
- Screener presets: Up to 50
- Customization: Layout and signals
Creating up to 50 portfolios lets you track your investment returns for multiple strategies and thematic investing.
FINVIZ*Elite
FINVIZ*Elite is Finviz’s premium tier and is ideal for frequent traders and those who want full access to the program. You will pay $39.50 monthly or $299.50 yearly (that boils down to $24.96/month).
Upfront payment is necessary for either subscription plan, but you can request a full refund during the first 30 days. So, use the first month to test drive the platform.
Core benefits include:
- Real-time stock quotes (includes premarket and aftermarket data)
- Advanced charts (Intraday, overlays, drawing tools, full-screen layouts)
- Advanced screener (Data export, customized filters, statistics view)
- Correlations (Positive and inverse correlations between selected stocks and ETFs)
- Backtesting (24 years of historical data, 100 technical indicators)
- Alerts and notifications (Instant email and push notifications)
- Ad-free layout
- Eight years of financial statements (vs. three years for registered users)
- Up to 100 portfolios (vs. 50 portfolios for registered users)
- Up to 500 tickers per portfolio (vs. 50 tickers for registered users)
- Max 200 screener presets (vs. 50 for registered users)
- Screener rows per page (100/120 charts/50 snapshots)
Finviz Free vs. Elite
Whether you should stick with the free version of Finviz or upgrade to the elite tier depends on your research needs, current research tools, and trading frequency.
When to Use Finviz Free
The free version is best for casual investors who tend to be long-term holders or only place a few transactions yearly. Further, the free features are sufficient to monitor your current portfolio or keep an eye on the broad market.
Even if you trade frequently, you may use the screener to find watchlist candidates with your selected fundamental and technical metrics. Then, you can use your brokerage or standalone tools with better charting capabilities to research and place a trade.
When to Upgrade to Finviz*Elite
The premium membership is best for frequent traders who rely on real-time data and want advanced screening and charting tools. Getting the message box saying you need to upgrade to a paid subscription to continue researching is a nuisance.
The $300 annual fee is significant, and you will need to trade regularly and use the Finviz tools consistently to justify the price. Still, this fee is competitive with similar stock research apps and more affordable when purchasing an annual membership.
Finviz Pros and Cons
There is plenty of information to consider in this Finviz review. Below is a summary of what I believe are Finviz’s strengths and weaknesses:
Pros
- Many free research tools for stocks and ETFs
- In-depth stock screener and heat maps
- Supports fundamental and technical research
- 30-day refund guarantee for paid memberships
- Backtesting for elite members
Cons
- Only covers U.S. stocks (excludes OTC and ADR listings)
- Free charting tools don’t include advanced indicators
- Portfolio tracker doesn’t sync with brokerage accounts
- The free version shows ads.
- No mobile app and not mobile-friendly
Alternatives to Finviz
The following websites are also excellent places to research potential investments and check up on current holdings. Before signing up with Finviz, I recommend checking out other platforms.
Morningstar Investor
Morningstar Investor is an appealing stock screener for fundamental investors. The screener contains over 200 filters to identify stocks, ETFs, and mutual funds matching your criteria. In addition, the Morningstar analyst team curates lists of the highest-rated stocks and funds for many categories, which serves as an excellent starting point.
A premium subscription also includes portfolio analysis and investment tracking tools that can help optimize your asset allocation and investment strategy. There is also much bullish and bearish commentary about the market and specific investments.
Read our Morningstar Investor review for more.
Learn More About Morningstar Investor
Seeking Alpha
Seeking Alpha has many overlapping research tools. You can read bullish and bearish commentary written by independent contributors for just about any stock and ETF. Finviz doesn’t really offer stock analysis but is better for researching stock metrics.
Seeking Alpha includes proprietary ratings that can make it easier to assess potential investments. Additionally, the premium version syncs with your brokerage accounts which saves time and prevents data input errors to quickly see the ratings of your holdings and track your investment performance.
You can learn about the differences between the free and premium memberships in our Seeking Alpha review, but compared to Finviz, the free research tools are somewhat limited.
Learn More About Seeking Alpha
Stock Rover
Fundamental investors and those with a buy-and-hold investment strategy may want to consider Stock Rover. Like Finviz, it’s got fundamental and technical stock screens, but the additional research tools cater to long-term investors instead of short-term traders.
Stock Rover’s customized stock screens can model legendary investors and prominent hedge funds, a unique feature. You can also read research reports and automatically sync your brokerage portfolios for effortless tracking and updates.
Four different plans are available, including a free membership. For more information, check out our Stock Rover review.
TipRanks
TipRanks is a great option for utilizing analyst ratings and investor sentiment. It also provides technical analysis and fundamental stock screens, and its charting tools are also helpful.
Investors can perform in-depth research on stocks and ETFs. Limited free analysis tools are available, but most functions require a paid membership.
FAQs
The best stock screener is the one that’s right for you. However, FinViz is ideal because it supports fundamental and technical metrics. You can also save screen presets when you create a free account. However, other services are better if you want to research OTC stocks and thinly traded penny stocks or have a platform with analyst reports as well.
Unfortunately, there isn’t a Finviz mobile app, and the Android or iPhone web browser isn’t user-friendly. Your best bet is to access Finviz from a desktop computer. Large tablets may also be sufficient.
Finviz has many free features, and most investors can use it without paying a dime, although you will view ads on each page. A paid membership is necessary if you want advanced charting tools beyond the simple moving average and to backtest or avoid ads.
Final Thoughts on Finviz
Finviz is an excellent stock research service that offers some of the best free research tools. It should be one of the first places you look for fundamental and technical analysis when you’re unsatisfied with your brokerage tools.
You can benefit from using Finviz whether you’re a short-term trader or long-term investor. It’s also an excellent research companion to investment newsletters, which provide a basic background for the monthly investment idea but still require further research before buying shares.
I don’t recommend Finviz if you prefer trading stocks from your phone since the site isn’t mobile-friendly and doesn’t have a stock screener app.