Planning for retirement can be tricky for a variety of reasons.
If you’re like me, you don’t know what your life will be in 10 years, let alone 40 years.
You want to save but you aren’t sure how much… so you turn to retirement planning tools.
But when you use retirement planning tools, they use assumptions. You have to guess how much you will need to spend in retirement. You have to guess how much you can save each year (aim for 30%!). And you have to account for all your investment accounts, from a 401k to IRAs to your taxable brokerage account(s). (what’s the difference between a 401k and IRAs?)
And even when you have done all that, you have to make the biggest assumption of all – what will the stock market do?
Simple retirement calculators will have you enter in a single number. More complex calculators will have you enter in a range. And even more complex calculators will run a series of simulations (you may see the words Monte Carlo simulations) based on several ranges (where the stock market return is just one factor) to give you a better sense of what you’d retire with.
But at its core, you’re assuming what the stock market will return over some time.
What number should you use? While that answer is up to you, one good place to start is the average stock market return.
Table of Contents
What is the average stock market return?
The average annual rate of return for the stock market varies based on the time frame. It also depends on what you consider “the stock market.”
I think the most accurate index to use as a proxy for “the stock market” is the S&P 500 index. But some believe the Dow Jones Industrial Average is “the market.” We will look at both.
S&P 500 since 1965
I like the S&P 500 because it includes 500 companies, whereas the DJIA only has 30. Every company in the DJIA is in the S&P 500.
If you read Warren Buffet’s Berkshire Hathaway letters, you’ll know he compares the return of BRK to the S&P 500. On the very first page, he lists the annual percentage change of both BRK and the S&P 500 with dividends, dating back to 1965.
The compounded annual gain from 1965 through 2018 is 9.7%. (source)
The 10-year average return on the S&P 500, ending in 2018 and including dividends, is around 10%.
Annual percentage change by year:
| Year | Percentage Change of S&P 500 with Dividends |
|---|---|
| 1965 | 10.0 |
| 1966 | -11.7 |
| 1967 | 30.9 |
| 1968 | 11.0 |
| 1969 | -8.4 |
| 1970 | 3.9 |
| 1971 | 14.6 |
| 1972 | 18.9 |
| 1973 | -14.8 |
| 1974 | -26.4 |
| 1975 | 37.2 |
| 1976 | 23.6 |
| 1977 | -7.4 |
| 1978 | 6.4 |
| 1979 | 18.2 |
| 1980 | 32.3 |
| 1981 | -5.0 |
| 1982 | 21.4 |
| 1983 | 22.4 |
| 1984 | 6.1 |
| 1985 | 31.6 |
| 1986 | 18.6 |
| 1987 | 5.1 |
| 1988 | 16.6 |
| 1989 | 31.7 |
| 1990 | -3.1 |
| 1991 | 30.5 |
| 1992 | 7.6 |
| 1993 | 10.1 |
| 1994 | 1.3 |
| 1995 | 37.6 |
| 1996 | 23.0 |
| 1997 | 33.4 |
| 1998 | 28.6 |
| 1999 | 21.0 |
| 2000 | -9.1 |
| 2001 | -11.9 |
| 2002 | -22.1 |
| 2003 | 28.7 |
| 2004 | 10.9 |
| 2005 | 4.9 |
| 2006 | 15.8 |
| 2007 | 5.5 |
| 2008 | -37.0 |
| 2009 | 26.5 |
| 2010 | 15.1 |
| 2011 | 2.1 |
| 2012 | 16.0 |
| 2013 | 32.4 |
| 2014 | 13.7 |
| 2015 | 1.4 |
| 2016 | 12.0 |
| 2017 | 21.8 |
| 2018 | -4.4 |
DJIA since 1965
For the Dow Jones Industrial Average, we turn to the data set at Macrotrends. The DJIA goes much farther back than 1965, the year that Buffett uses for his annual letters, so we will start with 1965 to maintain a closer comparison.
That said, one piece of the puzzle that I can’t seem to find is the rate of return including dividends. So this naturally misses dividends, which reduces the value of the DJIA every time they are paid out.
The compounded annual gain from 1965 through 2018 is 6.28%. (source)
If you make the really big assumption that the dividends were around 2% per year (which is what they are right now), you get an 8.28% figure that is lower than the S&P 500 return. You’d expect the DJIA to grow at a slower clip than the S&P 500, as it has larger blue-chip companies and the S&P has a wider variety of companies at different points of the growth curve.
Annual percentage change by year:
| Year | Percentage Change of DJIA |
|---|---|
| 1965 | 10.88% |
| 1966 | -18.94% |
| 1967 | 15.20% |
| 1968 | 4.27% |
| 1969 | -15.19% |
| 1970 | 4.82% |
| 1971 | 6.11% |
| 1972 | 14.58% |
| 1973 | -16.58% |
| 1974 | -27.57% |
| 1975 | 38.32% |
| 1976 | 17.86% |
| 1977 | -17.27% |
| 1978 | -3.15% |
| 1979 | 4.19% |
| 1980 | 14.93% |
| 1981 | -9.23% |
| 1982 | 19.60% |
| 1983 | 20.27% |
| 1984 | -3.74% |
| 1985 | 27.66% |
| 1986 | 22.58% |
| 1987 | 2.26% |
| 1988 | 11.85% |
| 1989 | 26.96% |
| 1990 | -4.34% |
| 1991 | 20.32% |
| 1992 | 4.17% |
| 1993 | 13.72% |
| 1994 | 2.14% |
| 1995 | 33.45% |
| 1996 | 26.01% |
| 1997 | 22.64% |
| 1998 | 16.10% |
| 1999 | 25.22% |
| 2000 | -6.17% |
| 2001 | -7.10% |
| 2002 | -16.76% |
| 2003 | 25.32% |
| 2004 | 3.15% |
| 2005 | -0.61% |
| 2006 | 16.29% |
| 2007 | 6.43% |
| 2008 | -33.84% |
| 2009 | 18.82% |
| 2010 | 11.02% |
| 2011 | 5.53% |
| 2012 | 7.26% |
| 2013 | 26.50% |
| 2014 | 7.52% |
| 2015 | -2.23% |
| 2016 | 13.42% |
| 2017 | 25.08% |
| 2018 | -5.63% |
Vanguard Total Market Fund
What about the flagship fund for the mutual fund giant, Vanguard?
Vanguard Total Stock Market Index Fund Admiral Shares (VTSAX) was created in 1992 and it was specifically created to “provide investors with exposure to the entire U.S. equity market, including small-, mid-, and large-cap growth and value stocks.” At a cost of just 0.04% (expense ratio), you get the market in one fund.
How has it fared?
VTSAX has returned 6.68% annually since November 2000.
Over the last 10 years, VTSAX has returned 16.05% per year (as of March 31st, 2019).
For comparison, the Fidelity Total Market Index Fund has returned 13.94% over the last ten years as of May 31, 2019. And 7.29% since inception in 1997.
The point isn’t to compare the two funds, since they span slightly different periods (which can have a huge impact on the return figures given recent volatility), but to illustrate the long term rate of return is around 7% for two massive total market funds.
What is a safe assumption for the stock market return?
I don’t invest money in the stock if I anticipate needing it within five years.
But when I project the rate of return for long term investments, such as retirement savings I won’t need for 30 years, I use 8% as my average. For years, experts used 10% but to build a bit of safety, I always used 8%.
This figure puts us between the DJIA and the S&P 500’s annual return ever since 1965. Now, the world was much different then. And the world will be much different going into the future. But I’m confident that 8% is a safe figure to use for the next 40+ years.
That said, I also look at my plan using 6% and 10% as the rate of return of the stock market. This will let me know where I am if the market does worse or does better than I expect.
Annual returns are very volatile
When we calculated the return of the S&P 500 index and the DJIA, we arrived at a single number. But if you look at the table of annual increases, it’s extremely lumpy.
You have double-digit increases, double-digit decreases, and everything in between.
Using an average is deceptive because it seems to imply the index increases slowly each year… but it doesn’t.
This is why you should only invest in the market if you can afford to hold those investments for many years. The trend is up and to the right but the ride is very bumpy.
What about stock market return predictions?
They’re mostly bullshit.
The news machine always needs feeding. At the start of the year, investing media loves to trot out experts to discuss what the markets will do in a year. This is how they make their money, which is cool, but not something we care that much about.
I am, however, interested in near term trends. I don’t care what the market does this year, but what about over the next five years? What about underlying economic conditions? Those give you a better idea.
Vanguard’s economic and market outlook report (2019 issue) does a good job of providing a lot of relevant information for the market and the economy. It does a good job of capturing the ideas (they correctly expected the Fed to stop rate increases in the summer but they had a Fed funds rate target of 2.75%-3%, whereas they paused at 2.5%) without being overly hype-driven.
This is a good chart to give you a sense of where the economy is for a variety of countries:
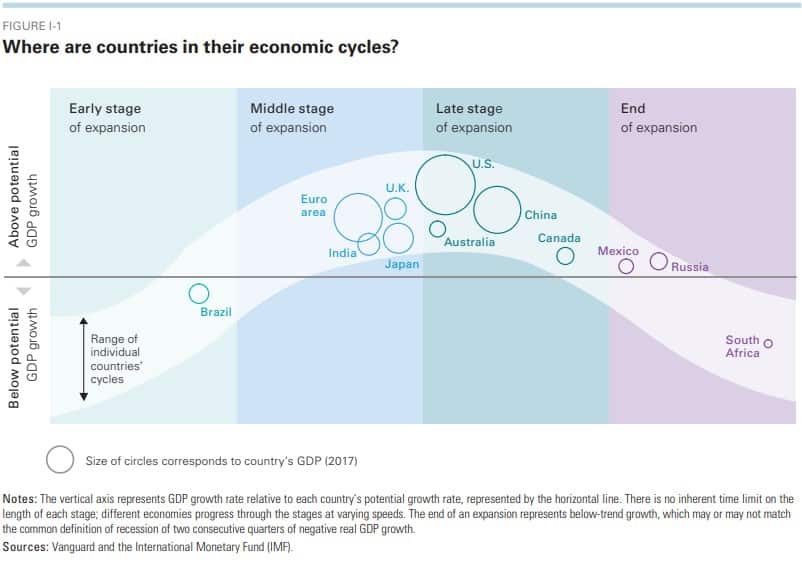
And if you aren’t familiar with how economic cycles work, watch this 30-minute explainer by Ray Dalio (it will instantly make you smarter).
That said, Vanguard expects global equity markets to return about 4.5%-6.5% and fixed income to return 2.5-4.5%.
You’d expect the U.S. stock market to have lower than expected returns simply because we are later in the economic cycle. It will be like that for several years until we get through the end of the cycle and start expanding again.
Will that take two years? Five years? Ten? With so many factors, it’s hard to know.
Would it be prudent to wait? No way. This is why I enjoy reading these reports but I don’t necessarily act on them.
What is a good rate of return?
The purpose of investing is to reach your goal. If you are twenty and your goal is retiring when you are 45 with $1.5 million, you want a rate of return that gets you there based on how much you can save each month.
If you can save $1,000 a month, you need an annual rate of return of 11.26% to reach $1.5 million in 25 years. If you have 30 years, you only need a rate of return of 8.34% per year.
If you can save $500 a month, you’ll need an annual rate of return of 15.6% to reach $1.5 million in 25 years. If you have 30 years, you only need a rate of return of 11.92% per year.
(I used Bankrate’s investment calculator to arrive at these numbers)
A good rate of return on your investment is one that beats the S&P 500 index – which we know has an average return of nearly 10%.
You can get a return of almost 10%, with the same risk profile, with just a click of a button. You can buy a mutual fund or ETF that tracks the S&P 500 without doing much research, comparison shopping, or any other leg work. This is why the big mutual fund companies have trillions of assets under management (compound interest helps that number get bigger and bigger too!).
If you want to learn how to start investing in the stock market, read our guide to investing your first $1000. It gives you a lay of the land so you can understand the vocabulary being used by the experts.


Great write up, Jim. It’s actually a little higher than I expected.
Excellent post, Jim. I alsi really enjoyed the Dalio video…very well done!
great post Jim – I’m saving this to re-read over the weekend.
Economic life cycle is a hypothesis. There is no guarantee about how long a cycle is and what phase we are in. We could be in expansion forever due to policies or in a bubble for a long time until it decides to burst. We have no control. Don’t act on economic news.
I think of it more as a mental model for understanding how the world may work. It’s a far better model than thinking it’s completely out of control or prediction. Yes the periods may be longer or shorter but there’s no mistaking periods of economic expansion and contraction.
The hardest part of retirement planning is guess how old you will live thru, with major medical expenses or not, only God knows!!!