NOTE: This post was originally published in 2017 and updated at the end of 2019, all pre-dating the pandemic, the stock market fall and rise, etc. The points are still valid but the story around it will feel dated – just a heads up.
Ever wonder if the stock market is expensive or cheap?
If you rely on mainstream media to tell you, you're making a huge mistake.
Ever hear the line “if it bleeds, it leads?”
It perfectly encapsulates what the “news” is all about. It's not about getting information to you, it's about getting you to watch. The more people watch, the higher the ratings. The higher the ratings, the more they can charge for commercials.
Just go back to articles from March of 2017) and read the “predictions” and see how they panned out. A Trump presidency was going to sink the market… but instead, it went on a tear. A HUGE tear.
They have crazy headlines about how the Dow is going to break 20,000 (!!!) and how the market is over-valued. By the way, it broke 20,000 in 2018. It's broke 21,000 recently too — but we've been recently gyrating around 21,000.
(Incidentally, the Dow Jones Industrial Average is just an index of 30 companies and is a terrible index if you want to think about “the market”)
Kick the hype machine in the shins.
If you need one simple number to know whether the stock market is “overvalued” – I have it. It's what the pros use and if you give me a few minutes, I'll explain it to you so you will be better informed. It was a revelation to me when I learned it.
It's called the CAPE.
What is CAPE?
CAPE stands for cyclically-adjusted price-earnings ratio.
The only way to tell if the market is overvalued is to compare it's P/E to historical values, typically within the last 10 years. If the P/E of the market is higher than it's average the last ten years then it's overvalued.
A simple example using oranges:
That's because your biases look at the number ($26), look at the product (an orange), and think that $26 for an orange is absurd.
But if oranges have been selling for $36 for the last ten years, Jimmy's oranges are cheap! (or something's wrong with his oranges!)
If they were selling for $16 for the last ten years, then you'd be crazy to buy Jimmy's oranges. Unless you really really really needed an orange.
The only reason you believe it's expensive or cheap at $26 is that you have a general idea of how much an orange costs.
How does that example apply to the stock market? The stock market has a historical price. It's called a P/E.
P/E is price to earnings ratio, or the price per share divided by the earnings per share each year. If Jimmy Oranges Inc. makes $5 a share and the stock market values each share of the company at $25, then the P/E is 5. If Jimmy Oranges Inc. is a sexy orange-y startup that makes no profit, then earnings are $0 and P/E is 0 (technically it's infinite… or not a number since you cannot divide by zero).
To get a historical look at prices, we use CAPE (cyclically-adjusted price-earnings ratio). Don't get bogged down by the cyclically-adjusted part, that just means we average it over an economic cycle so you're not making the mistake of looking at a boom or bust period.
With CAPE, we're talking about the CAPE of the S&P 500 (forget the DOW, that's junk) and a lookback period of 10 years.
The historical average of the S&P 500 CAPE is 16.4 (the median was 15.8). Half the time it's been between 11.6 and 19.7, so anything lower (bottom 25%) is cheap and anything higher (top 25%) is expensive. (you can look it up here)
That is an objective measure that you can't dispute. If you could historically buy earnings at 16.4x, then paying more makes it expensive. There's no judgment call here on whether it's a good or bad decision to pay more than 16.4x.
If you make regular contributions to your retirement and into an S&P 500 index fund, you're smart for doing it but you're just paying a little extra when the CAPE is over 16.4. It's better that you invest immediately than try to time the market and wait for the CAPE to dip (because it might now).
An Ominous CAPE Chart
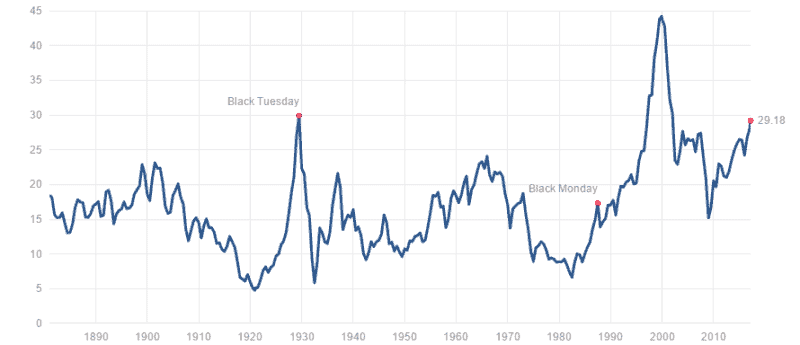
Scary huh? Hold onto your butts.
But wait… there's more.
CAPE can remain high for a while
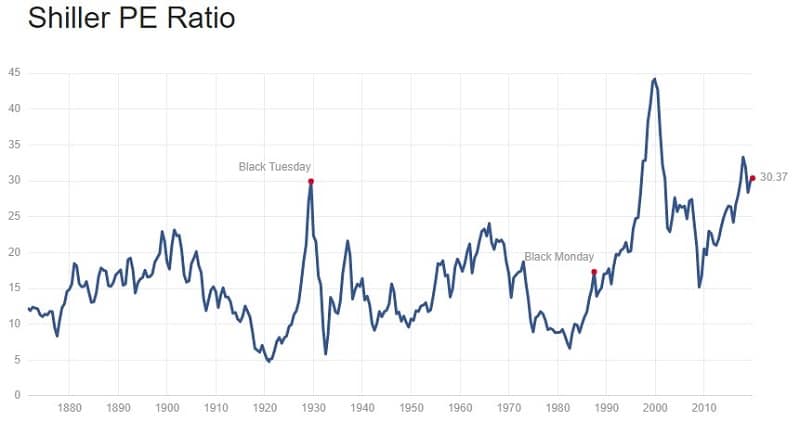
This post was originally published in March of 2017 and I'm updating it in December of 2019, over two and a half years later, and the CAPE is now 30.37.
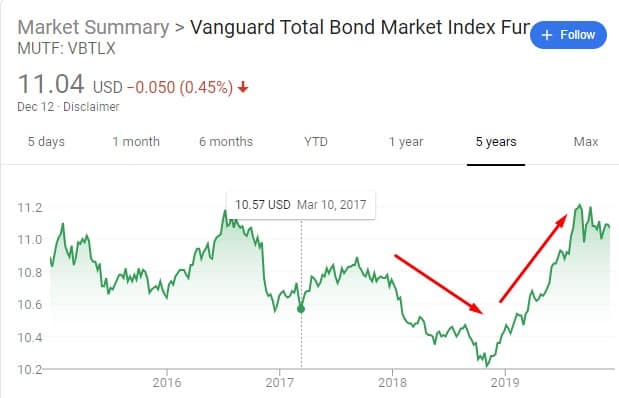
If you waited on the sidelines for the CAPE to go down before investing, you would've lost two and a half years. That said, if you put it in 100% bonds, you would've gone on a pretty crazy ride (for bonds):
So CAPE can be informative but it's not everything.
So what?
The CAPE, as of the original publishing date of March 2017, was over 29 (in fact, when I started working on this post a few months ago, the CAPE was just over 26). It's now over 30.
The S&P500 is expensive. It's been expensive for quite some time.
Mathieu Bouville went back and looked at the performance of the stock market and found that the CAPE had some predictive power. He even suggests an investment strategy based on the CAPE.
The gist of that is that when the CAPE is below 11.6, hold 100% stocks. When it's above 19.7, hold 100% bonds. In between, it's a linear function. He suggestions that based on CAPE, you should be adjusting your stock to bond allocation – and he's probably right.
But wait! There's more.
But there are non-zero costs for changing and based on your assets. (commissions, taxes)
So how can you use this without monitoring your allocation so often?
The best use of this is an idea I read on Can I Retire Yet? by Darrow Kirkpatrick. His post analyzes the best retirement withdrawal strategies (and his follow-up confirms it) suggests that when you need your retirement money and are picking which assets to sell, you can use CAPE to help. If CAPE says the S&P 500 is overvalued, sell those assets first. If it says the S&P 500 is undervalued, sell bond assets first.
The corollary to that is that if you're in accumulation mode (putting new money into the market), recognize that you cannot assume new money into the S&P will grow at the standard assumption of 7-10% per year. You may want to put it into bonds until the CAPE recovers, using a version of Bouville's strategy. Then adjust back to your target allocation when things are less frothy.
I don't mean to imply that you should time the market but you need to be reasonable in your assumptions given the state of the market.
I think that's the best use of the CAPE… besides impressing your nerdy friends at dinner parties when they're talking about the stock market.


The CAPE has been over 20 for 7 years. Was I supposed to have been out of the market that whole time? That wouldn’t have been a good strategy regardless of what the next correction in the market might bring. Be diversified and stay invested for the long term. Market timing is for fools.
No, which is why I believe the best use is in retirement when you’re drawing down. You should sell that asset class because it’s high (and because you need to sell). I think knowing whether the market is expensive is important, though high today doesn’t mean it’ll fall tomorrow. In fact, if it’s high today, it’s likely to remain high for years (also in Bouville’s analysis). That being said, it can’t remain high forever. I suspect that if I were to study this more, I’d say that if you were accumulating assets don’t change your strategy. Be diligent in re-allocation… Read more »
Great methods. I also blogged about this, and these are the metrics I came up with:
http://www.fromcentstoretirement.com/metrics-for-the-stock-market/
I really like Ray Dalio’s explanation of debt cycles, it’s probably one of my favorite videos.
You share some good metrics – inverted yield curve is one that always scares me because it runs counter to what you’d ever expect. When the 10 year yields less than the 2 year, and of course this is all set by the auction, seeing it makes you do a double take.
I think it’s good to keep this all in mind for sure and I like this synopsis. Further, I think it’s quite valid to follow this as a withdrawal method during retirement. I’ll be on the early retirement train in 3.5 months and I think this is a good article to file away as I need to access my assets. Since I decided to execute my exit strategy, this has been one of the issues weighing on me… what are the best mechanics/rules to follow once I’m at that finish line to meet my cash flow requirements once I retire?… Read more »
Dont have a question. Just really like this info. Thanks.
The CAPE has a pretty awful record of timing the stock market. In the late 1990s you would have sold way too early. You would have missed most of the last 8 years of bull market. Especially when you want to time Stock vs. Bond you don’t want to look at the stock market CAPE alone. You want to look at the difference between 1/CAPE (= earnings yield) and the bond yield. Because bond yields are still so low, the differential yield between stocks and bonds doesn’t even look so bad. But the CAPE has a pretty good track record… Read more »
I think that if you’re in accumulation mode, timing isn’t going to be the answer. If you’re nearing the start of retirement, when you should be gliding down from a more “risky”/volatile mix of stocks/bonds, a high CAPE means you should be on top of your allocations and not be sloppy with redistribution.
I never meant to imply, in any way, that you should use CAPE alone to make any decisions though! 🙂
I am in early accumulation phase still, 18 years until retirement, and was thinking about something interesting. I pay bi-weekly into retirement account regardless of what the market looks like because timing the market is for fools. I’m an equities guy, I currently hold 90% E 10% B but what if I used CAPE to load up a slush fund for more buying power during a down CAPE period? For example, CAPE is high currently, so without selling off any equities just re-allocating my deposits and leaving the current money where it is, load up on bonds. Then, when CAPE… Read more »
It’s still market timing and while expensive, it’s still a good idea to invest in equities if you’re not retiring (and needing the money) for many years.
Hi Jim, Thank you for writing this article on CAPE and valuations. I think that valuation is important, but growth in earnings is important as well. CAPE levels will decline from today once the atrocious earnings from 2007 – 2009 are out of the picture ( and hopefully earnings are not too bad in 2017 through 2019). And if earnings do finally start growing again, we may do well if we buy, hold and live the good life. In general, I think that timing using any single indicator is probably going to look great in a backtested model, but not… Read more »
I’m retired. Out of the market for 20 years because I was burned. I live on other fixed income. At 77, I want to re-enter with 25% of my liquid assets “when appropriate”. What strategy do I use to re-enter the market? Dollar cost averaging using some period like 10% a year and starting now? I just tried buying $1k of stock for a “trial” and lost 50% of that $, so I’m not keen on the principle of “buy now because timing doesn’t work.” I seem to have a strong urge to buy when the market is at a… Read more »
There’s no right answer because we don’t know what the future holds and I don’t put money into stocks unless I have a holding period of greater than 5 years. If I were you, I’d stick it in index funds rather than a single stock and DCA in over whatever period you feel comfortable to smooth out the bumps. You can’t wait for CAPE I’m afraid.
Sigh, I should have known not to expect help from CAPE!
Can you offer any advice what period of dollar cost averaging might be expected to “smooth out the bumps” reasonably? (based on data, not “feel comfortable”)
5 years? (Put in 20% a year)?
I’m afraid past performance is not indicative of future results… there’s no proof that DCA is even better than lump sum. If the market keeps going up, lump sum now obviously works better than DCA over any period of time. If it goes down, well then DCA works better.
This is great post, adding CAPE to the toolbox, always good to have another data point. One thing I was thinking is maybe CAPE alone shouldn’t be used but maybe a standard deviation approach like a Z score for CEF’s with CAPE as the metric. Maybe the CAPE score will be hight forever, but the dips below the normal “too high” are the indicators to buy.
Interesting stuff, thank you for posting!
CAPE along isn’t enough because, as you said, perhaps we are living in a world where it’s not “too high” but simply “a bit high.”