Have you heard or read the statistic that 40% of Americans wouldn’t be able to cover a $400 emergency?
It comes from a Federal Reserve report, the “Report on the Economic Well-Being of U.S. Households in 2018” released in May 2019.
Results from the survey show that many adults are financially vulnerable and would have difficulty handling an emergency expense as small as $400.
I was skeptical about the statistic (I trust the source, I just wanted to understand it better) and so I dug into some of the data to learn a little bit more. It turns out that the average savings in America is quite low. While we can argue about the reasons why, there’s no arguing that the balances need to be higher if people are going to feel any sense of financial security.
Table of Contents
Our Data Sources
Most of our data will come from various parts of the Federal Reserve.
I love the Federal Reserve’s Survey of Consumer Finances because it gives us incredible insights into the finances of the average American. It’s conducted every three years by the Federal Reserve System in cooperation with the Treasury Department. The latest release was for 2019 but 9% of the surveys were completed in February and April of 2020, the early months of the pandemic.
Despite the impact of Covid-19, I think the information is still useful to study.
Personal Savings Rate in America
I want to start with the Personal Saving Rate, a statistics reported by the St. Louis Federal Reserve, which skyrocketed during the pandemic.
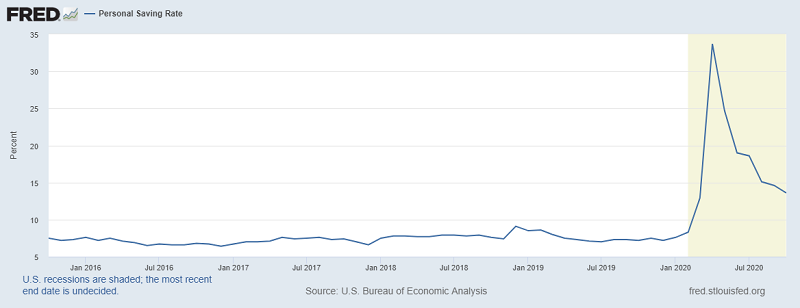
The peak of the graph corresponds to April 2020 when the personal saving rate hit 33.7%! This corresponded with the passage of the CARES Act on March 27th, 2020. Stimulus checks weren’t being issued until a few weeks later, and there were issues with the rollout, but it probably helped contribute to the spike.
Even October 2020, the last month available, we have savings rates of 13.6% – a rate we haven’t seen, on a sustained basis, since the recession of the early 1980s. Americans don’t have a long history of saving a lot of their income.
Average Savings Balance in America
Now that we know that recent history has our savings rate around 6-8%, what are our savings balances? How much should you have saved at what age?
For this, we have to break it down and define what “savings balance” means. The Federal Reserve doesn’t have that as a category and breaks down financial assets into these categories:
- Any financial asset: This is the parent category that includes all the other assets.
- Transaction accounts: These include bank accounts (checking, savings, money market) plus prepaid debit cards
- Certificates of deposit
- Savings bonds
- Bonds
- Stocks
- Pooled investment funds: Mutual funds, ETFs, hedge funds,etc
- Retirement accounts
- Cash value life insurance: Such as whole life insurance, which has a cash value component
- Other managed assets
- Other
Money is fungible so you could argue that adding that all up would equal your savings (and you’d be right) but I think that’s not what our objective is. We’re not looking to know the liquid net worth of the Average American – we want to know how much is in “savings.”
So my definition of savings includes just the first two categories – transaction accounts and certificates of deposit. I think of all the other financial assets as having a purpose beyond being “savings.”
If you want to include all financial assets (“All Assets”), then the median savings balance in America for 2019 was $25,700 and the mean savings balance was $363,700.
Holding and Value of Financial Assets (2019)
This is the data straight from the SCF:
| Category | Median Value | Mean Value |
|---|---|---|
| Any financial asset | $25,700 | $363,700 |
| Transaction accounts | $5,300 | $41,700 |
| Certificates of deposit | $25,000 | $102,000 |
| Savings bonds | $800 | $8,500 |
| Bonds | $121,000 | $653,600 |
| Stocks | $25,000 | $348,500 |
| Pooled investment funds | $110,000 | $854,300 |
| Retirement accounts | $65,000 | $255,200 |
| Cash value life insurance | $9,000 | $41,000 |
| Other managed assets | $115,000 | $512,200 |
| Other | $4,000 | $73,800 |
My first reaction to reading this is that there is a staggering difference between the mean and the median – $363,700 mean vs. a $25,700 median. This tells me one thing – there’s a pretty sizable wealth gap (something we already know). As the joke goes, when Bill Gates walks into a room, the average person in that room is a millionaire (at least!).
The same could be said if someone who is 70 walks into a room full of 5-year-olds, so we need to break this down into age groups.
Average Savings by Age
In the table below, Cash Savings refers to just transactional and certificates of deposits. All Assets means all financial assets.
| Age | Cash Savings (Median) | Cash Savings (Mean) | All Assets (Median) | All Assets (Mean) |
|---|---|---|---|---|
| Less than 35 | $8,200 | $30,800 | $8,400 | $34,700 |
| 35 – 44 | $9,700 | $66,200 | $22,700 | $170,700 |
| 45 – 54 | $17,100 | $174,100 | $36,200 | $373,100 |
| 55 – 64 | $40,700 | $190,100 | $46,300 | $569,700 |
| 65 – 74 | $48,300 | $187,600 | $53,700 | $642,200 |
| 75+ | $44,300 | $155,200 | $51,500 | $517,400 |
Age is also a little tricky to use so I wanted to break it down by another category, percentile of net worth.
Average Savings by Percentile of Net Worth
Remember, Cash Savings refers to just transactional and certificates of deposits. All Assets means all financial assets.
| Net Worth Percentile | Cash Savings (Median) | Cash Savings (Mean) | All Assets (Median) | All Assets (Mean) |
|---|---|---|---|---|
| Less than 35% | $2,900 | $5,700 | $1,400 | $5,500 |
| 25-49.9% | $5,500 | $15,900 | $11,100 | $22,700 |
| 50-74.9% | $24,500 | $51,200 | $60,300 | $83,800 |
| 75-89.9% | $56,000 | $119,000 | $299,600 | $333,200 |
| 90-100% | $180,000 | $522,300 | $1,339,000 | $2,811,300 |
As we can see, the savings balances of Americans in the bottom 35% of net worth is quite slim. With just $2,900 “in the bank,” there isn’t much room for error. For many of those families, that’s their working balance too – it’s not “savings” in the sense that they have it for a rainy day. It’s all the money they have.
This is part of the reason why the Federal Reserve reported that 40% of Americans couldn’t handle a $400 emergency – the bottom 35% by net worth have so little cushion. The median value of their financial assets is just $1,400. That means half of the bottom 35% have less than $1,400 of any financial asset.
This doesn’t even yet take into consideration any personal debt and servicing that debt!. The median credit card debt for 2019 was $2,700 while the mean was $6,300.
I suspect the impact of the pandemic will further decrease savings account balances, especially those in the weakest financial positions, despite what the Fed says about personal savings rates.


I had always wondered about the context for the $400-emergency statistic too! Thanks for taking a deep dive here!
Great information and enlightening! Thanks for digging this up and providing to us. One thing has me puzzled in the last table (Asset Savings by Net Worth Percentile): In the Less than 35% percentile group, the Median All Assets figure is lower than the Median Cash Savings. Ditto for the Mean All Assets vs Mean Cash Savings.
It’s one of the quirks of sampling a population – you can have someone who has very little cash but a lot in other asset classes (retirement, for example). This would result in a lower cash savings amount but a higher all assets, since retirement isn’t counted towards cash.