You’ve probably heard of “the 1%.” They’re the absurdly wealthy who have more wealth than the remaining 99% (based on data from Credit Suisse).
But what does it take to be in the 10%? 20%?
Is it still stunningly wealthy? Or does the line drop quickly?
We know that the average net worth of Americans is lower than you’d guess, but what about income? Is it the same?
So many questions!
Fortunately for us, we have two reputable data sources for this type of information:
- The Social Security Administration. Everyone who earns a paycheck will make payments to Social Security and Medicare, so they have that information as wage statistics. (last refreshed with 2022 data, which is the most recent dataset released in late October)
- The U.S. Census Bureau collects this information too. The latest is based on the latest Current Population Survey (CPS) and Annual Social and Economic Supplements (ASEC).
Whereas the SSA collects actual wage data, the Census Bureau conducts surveys and estimates values. Another big difference is that the SSA collects individual wage information and the Census estimates household income, so it is not accurate to compare them with one another.
(We used U.S. Census data when looking at average net worth of Americans)
We’re going to look at the Social Security Administration data first (since it’s based on actual data) and then the U.S. Census Bureau’s estimates (since it’s based on surveys).
📔 Quick Summary: According to the most recent Social Security data (2022), the median income was estimated to be $40,847.18, an 8.67% increase over 2021 ($37,586.03). The average income was $61,220.07.
According to the most recent Census data (2022), median household income was $74,580 (± $968). Average household income was $106,400 (± $1,034).
Social Security data isn’t updated until mid-October of the following year so 2023 data won’t be available until mid-October 2024.
Table of Contents
🔃 UPDATED: This post was most recently updated to include the release of wage statistics for 2022 by the Social Security Administration, which was released in October of 2023. This is the most recent data from the SSA for wages. We have also updated the Census Bureau data with the latest 2022 data.
Average Wage Index (SSA)
First, a definition – the national average wage index is calculated using compensation that’s subject to Federal income taxes as reported on W-2 Forms. This includes wages, tips, etc.
It doesn’t capture a household’s entire income throughout the year. This is strictly a measure of how much they earn from day jobs.
For example, dividends and capital gains aren’t included because they’re not wages. There’s also a little complexity involved with deferred compensation plans but for the purposes of our discussion, this level of specificity isn’t necessary.
🤔 Quick clarification on SSA numbers – they produce two “average wage” numbers. The first number is the average wage number calculated directly from their data.
The second number is a calculation that takes last year’s average and multiplies it with the annual percentage change in average wages, which they calculated from their tabulated wage data. I don’t know why they do this but it results in two different numbers.
According to the SSA, the average wage in 2022 was $61,220.07. (calculated from actual data)
The median wage in 2022 was $40,847.18.
(The second average, calculated by multiplying last year’s average by the annual change in wages, is $63,795.13)
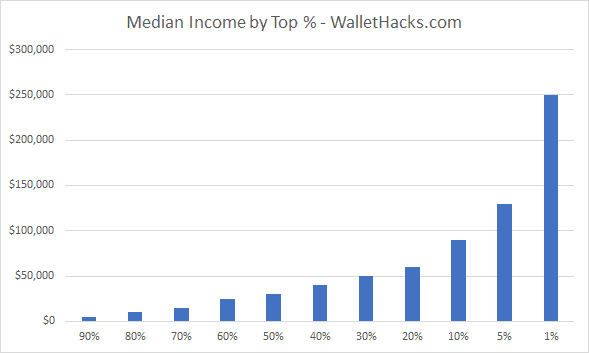
For fun, the figures below concerning percentages are taken from the data SSA provides but are themselves not averages (or medians). So the average of the Top 1% is not $250,000 a year – it’s how much you need to earn to be within the top 1% of wage earners.
Top 1%: $350,000+
How many households are in the top 1%? Over 480,002 earners are in the top 1%.
This may surprise you but to be in the top 1% of wage earners in the United States in 2022, you need to earn over $350,000 a year. You have to be in the $350,000 – $399,999.99 grouping and, likely, near the higher end.
That’s quite a tidy sum to earn in a year, that’s for sure, but I bet you thought 1% would require a much higher number.
Top 10%: $120,000-$350,000
How many households are in the top 10%? Over 1,389,426 earners are in the top 10%.
To be in the top 10% of earners, you had to earn more than $120,000.00 a year. That seems like a modest sum to be in the top decile of earners in the United States but fewer than 1.4 million earners reach that.
Top Half: $35,000
How many households are in the top 50%? Less than 9,502,181 earners are in the top 50%.
Here’s another number that may surprise you – to be in the top half (50%) of all earners you need to earn somewhere between $35,000 – $39,999.99 a year (again, towards the higher end of that range). The number of people earning less than $30,000 accounts for 38% of the population.
For reference, the 2023 Poverty Guidelines for a family of four is $30,000 ($43,930 in Alaska and $40,410in Hawaii).
Mull that one over for a minute…
Deciles (and more)
The deciles won’t be too clean-cut because the table is set up as salary ranges, but you can read this table as “how much do I need to earn to be considered top X% of salary earners.”
(A range means the decile falls somewhere in that range)
- 1%: $350,000
- 5%: $165,000
- 10%: $100,000
- 20%: $115,000
- 30%: $55,000
- 40%: $45,000
- 50%: $35,000
- 60%: $25,000
- 70%: $15,000
- 80%: $5,000
- 90%: $0.01 — $4,999
How many people make more than $X?
You may be curious to know how many people make more than $X, we have the data:
- How many people make more than $100,000 (six figures) a year? 2,186,317.
- How many people make more than $250,000 a year? 1,222,641.
- How many people make more than $500,000 a year? 704,054.
- How many people make more than $1,000,000 a year? 118,974.
- How many people make more than $2,000,000 a year? 20,407.
- How many people make more than $5,000,000 a year? 11,182.
- How many people make more than $10,000,000 a year? 3,712.
- How many people make more than $20,000,000 a year? 1,296.
- How many people make more than $50,000,000 a year? 227.
The Wealthy Are Absurdly Wealthy
These two (and a half) facts will boggle the mind:
- In 2022, there were 227 households (out of 172,030,932) with wages over $50 million.
- This is a sizable drop from 2021 when there were 506 households.
- In the 2019 data, there were 222 households that made over $50 million. In 2020, it was 358.
- In 2021, there were 117,713 households with wages over $1 million. 118,974 households hit that number in 2022 – so very similar.
Those are just wages. If someone made over $50,000,000 in a year, how much you want to be they have other sources of revenue (dividend, capital gains, etc.)?
They pull in WAY more than $50 million!
Another little “oddity:” (which holds true now, but this is 2015 data in the chart)
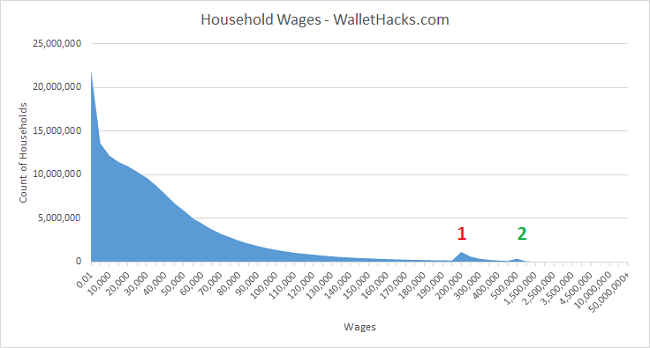
On the X axis you have the ranges of wages and on the Y axis you have the count of households. You’d expect the chart to just slope downwards, as there are fewer and fewer households included in higher incomes.
But there are two hitches, indicated with the red 1 and green 2. Red 1 is the $200,000 – $250,000 range and Green 2 is $500,000 — $999,999.
At first, I was trying to understand why this might exist. Could there be tax implications? Perhaps there is some rule somewhere else that had folks trying to pull their income down?
No – the rows of the table aren’t equal. Those two ranges are just wider!
Up until the Red 1 range, the rows had a range of $5,000. With Red 1, the range jumped to $50,000. The same is true for Green 2, the range jumped to $500,000. There are more hitches but they’re not visible in the chart, but it’s the same reason. Weird they structured it that way but that explains the weirdness in the chart.
For a second, I thought maybe something fun was happening like people shifting around their income to avoid tax law changes at different tiers… but sadly no. Just weird
✨ Related: Fun Jobs that Pay Surprisingly Well
Median Household Income (U.S. Census)
The data is from 2022 and it’s organized slightly differently than the data from the Social Security Administration. Since the SSA has real data and the Census surveys a few households (~131,400), the Census uses more ranges and tries to reach statistically significant results (since it’s based on a sample).
You cannot compare the two datasets. I presented the SSA data first since it’s real data (somewhat incomplete) but the Census information is useful too.
The median household income was $74,580 (± $968), a 2.3% decline from 2021.
The mean income was $106,400 (± $1,034).
Median Income for Households by Age
| Age of Householder | Median Income |
|---|---|
| Under 65: | $85,860 |
| 15 – 24 | $52,460 |
| 25 – 34: | $80,240 |
| 35 – 44: | $96,630 |
| 45 – 54: | $101,500 |
| 55 – 64: | $81,240 |
| 65+: | $50,290 |
Income Distribution
| Income Range | Percent Distribution |
|---|---|
| Under $15,000 | 8.3% |
| $15,000 – $24,999 | 7.4% |
| $25,000 – $34,999 | 7.6% |
| $35,000 – $49,999 | 10.6% |
| $50,000 – $74,999 | 16.2% |
| $75,000 – $99,999 | 12.3% |
| $100,000 – $149,999 | 16.4% |
| $150,000 – $199,999 | 9.2% |
| $200,000+ | 11.9% |
When you couple this data with the average net worth data, it can be very sobering.
Average Income by Education
With student loan debt topping $1.7 trillion (HOLY CRAP) as of October 2023, you might be wondering if there’s a relationship between average income and education.
There is:
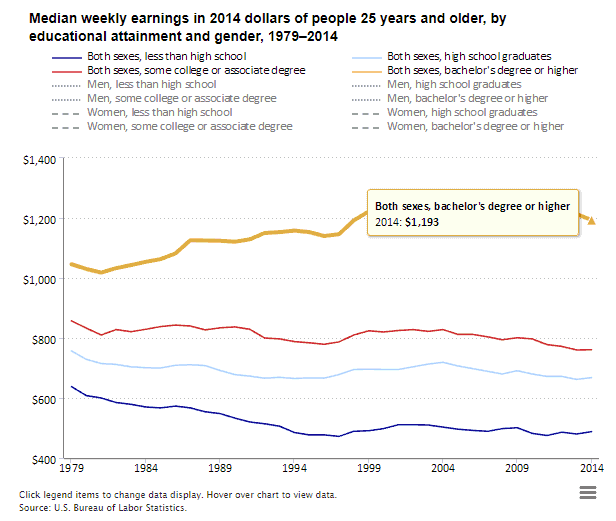
The sexes are combined and separated into four categories – less than high school, high school graduates, some college/associate degree, and bachelor’s degree or higher. These are 2014 dollars:
- Less than high school – $488/week ($25,376/yr)
- High school graduates – $668/week ($35,776/yr)
- Some college/associate degree – $761/week ($39,572/yr)
- Bachelor’s degree or higher – $1,193/week ($62,036/yr)
What you study matters, but overall the more education you have the better off you’re likely to be. There is a huge difference between those who start college and those who finish.
Also, this doesn’t capture where they are opportunities in the workplace because of uneven supply and demand for work. For example, here are 14 jobs that make over $70,000 and don’t require a college degree. The data comes from the BLS and include jobs that are in high demand, require some on-the-job training, but do not require college.
One prime example is something you’ve probably used many times before – an elevator. Elevator installers and repairers have a median income of $79,480. You will likely need to go to technical school or get an apprenticeship to learn the trade, college is not necessary.
Lastly, income doesn’t tell the whole picture (for example, it’s hard to know what is wage income and what comes from income producing investments and assets) but these numbers do open your eyes.
If you are making $30,000 a year as your salary and working a 40-hour week all 52 weeks of the year, you’re making approximately $14.42 per hour.
If you have a two week vacation, your hourly rate goes up to $15.00.
If you are making $45,000 a year as your salary and working a 40-hour week all 52 weeks of the year, you’re making approximately $19.23 per hour.
If you have a two week vacation, your hourly rate goes up to $20.00.
If you are making $45,000 a year as your salary and working a 40-hour week all 52 weeks of the year, you’re making approximately $21.63 per hour.
If you have a two week vacation, your hourly rate goes up to $22.50.
If you are making $70,000 a year as your salary and working a 40-hour week all 52 weeks of the year, you’re making approximately $33.65 per hour.
If you have a two week vacation, your hourly rate goes up to $35.00.
If you are making $100,000 a year as your salary and working a 40-hour week all 52 weeks of the year, you’re making approximately $48.07 per hour.
If you have a two week vacation, your hourly rate goes up to $50.00.
If you are making $100,000 a year as your salary and working a 40-hour week all 52 weeks of the year, you’re making approximately $480.76 per hour.
If you have a two week vacation, your hourly rate goes up to $500.00.
What are your biggest takeaways from this data?


Jim,
Cool analysis of the data. I was surprised to see that just 202 households earn $50 million or more. That’s a small enough number to sort of humanize it. We could probably figure out a bunch of them from public data. CEOs, etc.
-RBD
I’m always confused why you and others use the Poverty Guidelines for a family of four when the average family in the USA is around 2.5, and has been for many years?
I’m confused why you’re confused because a family of four is 2 parents, 2 kids. You can’t have half a kid?
The difference is between the “average family” and the “average household”
A million families have 2 kids and another million families
have 3 kids. That’s 2 million families with a combined total
of 5 million kids. Divide 5 million by 2 million and that’s
2.5 kids per household as an average. Simple math!
LOL. Well said.
CEOs….maybe…actors, entertainers, is more like it.
Average SAG actor pay is about $56k/year.
Jonah Hill got only $60k for his role in “The Wolf of Wall Street”
Sure, Leo D.C. got $25mil, but he’s a top-top-top talent.
Average S&P 500 CEO pay was ~$14mil last year
5 Top paid CEOs in 2017 got between ~$50mill and $100mil
Even CEOs for tiny companies get ~$120k
Interesting! I did think to be in the top 1% of wage earners you would need to have a higher income, $250k while impressive seems low for the top. Over $50M Wow, just Wow!
The “top 1%” in terms of wealth….is FAR different than the ‘top 1% wager earner’. Most of us fail to truly understand that the real ‘wealthy’ among us do not have to work….nor do their children.
We worker busy ourselves w/ ‘paycheck’ envy of those with a few scraps more than us…meanwhile the true 1% keep earning massive amounts of passive income (dividends, yields…not wages) from ungodly amounts of generational wealth.
I think your point is well taken but it’s not the 1% – it’s a far smaller group.
According to Dave Ramsey most Millionaires are self made, not in the Lucky Sperm Club – Inherited Wealth Club.
Most Inherited wealth lasts 1-2 generations at most.
I like that you brought Dave Ramsey into the conversation. On a daily basis I see young couples push through paying off their student loans… Me and my husband did it, and we had about $50k in debt. I feel as though many Americans live beyond their means; then complain about the debt. I’m so tired of people not taking responsibility for their actions, and they always use the government to bail them out.
I’m pretty amazed that $90k gets you in the top 10% and $130k gets you in the top 5%! 80/20 rule at play here perfectly!
I am a retired law enforcement officer with a retirement income of $90,000 and my wife is a grade school teacher with an income of $45,000. We live well within our means, but we don’t feel that we are in the 5%.
I think there are a lot of other costs living in this country, as someone who has lived in another country previously. For example, unusually high healthcare costs (compared to universal healthcare in most developed countries), education debts (many developed countries have very low cost or free college education, high taxes (including property taxes, sales taxes, etc.), tips (many developed countries don’t require tips at restaurants, even if it is a nice gesture, it is much lower than 5%), domestic helpers are not affordable to most Americans, and the list adds on. In terms of personal savings, Americans are fairly… Read more »
I’ve lived in 3 countries. Collage costs “seem”cheaper in other countries. Until you realize for that “Free College” isn’t quite so free. Let’s take Germany for example. At $50,000 a year the marginal tax rate in America is 12%. For an equivalent income in Germany your Marginal rate is about 42%. That’s about $15,000 a year for “Free College and Free Medical Care.” For life. Whether you go to college or not.
I believe but could be mistaken…… the extra $15 000 a year germans pay is for free education for themselves and for their children who make no income. It also pays for free health care and covers retirement, unemployment, and long term nursing care to which US citizens pay extra for. Not to mention the tax rate in Germany is 14% to 42%….meaning not everyone is paying as much as $15 000.
These “developed countries” also have to rely on the United States innovation of drugs, medical equipment, and many research parties.
Great analysis Jim. Even more sobering would be to look at American median incomes compared to the world median income. The top 1% of this country would look EVEN MORE absurdly wealthy.
That is what capitalism does for a country. If you work hard and take risk you can make a lot of money. I would like to see how many 1-5% income levels go bankrupt or lose their fortunes, or their children squander it and lose it all. I think wealth keeps rotating. Bill Gates as an example.
That’s the myth of capitalism, the reality is that wealth is largely inherited and economic mobility is limited. There are notable exceptions, of course, but wealth does not keep rotating, it has been accruing to fewer people & families for at least half a century now.
Actually the reverse is true. Almost all super wealthy people in the US made their own fortunes by themselves.
The real myth is that others having wealth denies all the rest of us wealth. Also, people see wealth numbers and fail to recognize that wealth is normally accrued over a lifetime and largely reflects your decision making over a lifetime. A growing economy provides an opportunity for everyone to earn, save, invest and develop wealth. If you’re young, you won’t have wealth until you near retirement in most cases. If you’re older and do not have wealth then I’d be curious about your decision making. Either way, our results are up to us. I could care less if people… Read more »
Amen Brad! I couldn’t have said it better myself.
Lets reiterate for the masses shall we:
The real myth is that others having wealth denies all the rest of us wealth.
yes!! That is a great point! I have said that so many times.
That is not true. Even this report showed more people reaching super wealth status. And you can quote any study you choose, but what other system allows the upward mobility capitalism does? There isn’t one. The richest people in America dont come from extreme wealth. Bezos, Gates, Cuban, ext are 1st generation super wealthy. Hell, both my parents were from single mother homes who were “Grapes of Wrath Dust Bowl” kids from the mid-west. “Okie White Trash.” In one generation my brothers and I would qualify for top 5% income status. A wise man once said “Ours is the worst… Read more »
It’s not quite fair to blame it on the “free” market, given the size and heavy regulation in the US these days. Also, the policy the last 12 years of QE and ZIRP has really increased the wealth gap. The Fed is not the free market. This also goes against the argument that people make it on their own. Many get help from our crony capito-socialist system.
I think it also depends on where you live. I live in rural farming area and my income is higher than most in my area, but 50% “less than someone my age should earn”. I would love to know how to find a $71k per year job to match the median for my age!!! Most adults in my area earn under $50k per year in “good paying jobs”.
Great breakdown of the data Jim. One quirk I found interesting was the sudden drop in median income, in the 55-64 age range, before it spiked up with the 65+ crowd.
Always fun to step back and look at the larger picture of income and wealth!
Ha that was actually a bad bad bad typo – I copied a table from another post but erred on updating some of the numbers!
Thanks for admitting that was a (bad) typo!
They happen!
It is important to remember that these income studies are very general in nature. They never take into consideration the individual person’s intelligence and initiative. For example, what it takes just to search for job openings, figuring out the application process, how to sell yourself with a resume, having modern day computer and communication skills, and the need to make personal sacrifices such as relocating. Believe me, there are many examples of employees in state and federal government (me as one of them) who have bachelor’s degrees and more than 15 years of experience who earn LESS than high school… Read more »
They are averages and median. They take into account outliers, but outliers do not change the distribution noticeably.
50% correct. Outliers have little impact on the median, as you can convince yourself using a pocket calculator.
Great stuff and very interesting. Are these figures gross income or what people actually take home?
It’s gross wage income as reported to the Social Security Administration via Form W-2. This doesn’t capture folks who have a lot of cash flow from investments.
Do these calculations include children? It’s unclear what distinction you make between households and individuals. If you take the numbers and divide by population, you’re going to include a lot of children who earn nothing, and divide their parents’ wages by that number. You have to be consistent with your calculations.
It’s based on the Social Security Administration’s data, so it doesn’t include children. It’s not a “total income / total population” calculation.
Just read “Democrats face early division over rules for tax hikes” – WaPo 11-16-2018. Using this article as a rule of thumb, if passed (unlikely) most two income families (50%) would see increased taxes. Have I interpreted this correctly?
The article seems to address the procedures surrounding tax changes, rather than any particular tax change.