Americans have a funny relationship with money. We, as a society, celebrate the ostentatiousness with which the Kardashians live their life on TV. They are famous because they are rich, have cameras, and show a little vulnerability so people feel like they can relate.
TV is entertainment. It’s an escape. It’s fun. I don’t begrudge that or them.
But it becomes dangerous when you start internalizing that, confusing net worth for self-worth, and bringing that thinking out of the experience.
Your net worth is a lot like your weight.
It’s a single number that does an adequate job of capturing your financial health but it’s not the most important.
You can calculate it quickly, especially when using a free tool like Personal Capital, and accurately with much work.
But you can’t compare yours with someone else’s without knowing a lot more information. The average lineman in the NFL is over 300 pounds – is that a healthy or unhealthy weight? Now factor in their average height of 6′ 5″. And how quickly they can cover 40 yards (around 5 seconds).
Your net worth is valuable to know, net worth benchmarks are valuable to compare against, but it is just one metric. A valuable metric but not the ultimate one.
Table of Contents
The One True Benchmark
Before you see these five net worth benchmarks, I want to share the only true “benchmark” that matters.
We all start at different points. I was fortunate that my parents emigrated to the United States, were well educated and employed full-time for my entire life, and were able to provide financial assistance in college. I graduated with $35,000 in student loan debt but that’s nothing compared to some of my peers.
I had it good.
When I point to my net worth in my twenties, that’s a function of my good luck. I chose a degree that was in demand (Computer Science), got a good job in a strong industry (defense), and my net worth improved each year.
And that’s the one true benchmark – me vs. last year. Me vs. 5 years ago.
Understand your own financial progress. Over a five year window, your net worth should increase. Year to year it might fluctuate, especially if you’re investing in the stock market, but the trend should be moving upwards. And tracking my net worth keeps me grounded.
That’s it. That’s the one true benchmark. Yourself.
Also, home equity plays a role in net worth but it’s not always clear how you should value your home. I set it to be the purchase price and never touch it. It’s not ideal but it’s simple. Here are a few other ways to determine how much your home is worth.
Now, onto these benchmarks.
1. Positive Net Worth 10 Years After Graduation
(I say graduation but I mean 10 years of “full earning potential” — so if your career involves relatively low paying residencies or internships before “full earning potential,” take that into account)
This first net worth benchmark is more about managing your debt than anything else.
That first year you’re out in the real world is an expensive wake-up call. If you rent an apartment, expect to put down the first and last month’s rent plus a security/cleaning deposit. If you don’t yet have a car, expect to get one to help you get around unless you’re fortunate and live near mass transit. Depending on your level of fiscal prudence in school, you may have some credit card debt too.
All that will result in a negative net worth. Aim to get that to a positive within ten years of graduation.
The wildcard in this benchmark is student loan debt. Like a car loan, it’s an enabling debt. With a degree, you’d expect to get a higher paying job than without. It’s also like a car loan, buy too much car or too much college and you’ll be paying for it.
This benchmark is meant to be a target – push hard for this. You are not a failure if you don’t achieve this. You are not a success if you do. It’s merely the beginning.
2. Net Worth by Age and Income
The Millionaire Next Door has my favorite equation for how much net worth and it’s based on your pre-tax income (excluding inheritances and other one-time events):
It’s very simplistic but benchmarks are supposed to be simple. It has a tendency to be high early on (the first 5-10 years of full time work) and doesn’t account for geographic costs of living. Or fluctuating income. Or a million other things.
If you are 25, make $50,000 a year pre-tax, then you “should” have a net worth of $125,000 according to this equation. If it’s your first year working, that’s unlikely. It’s also unlikely if it’s your third year working and you live in Manhattan!
It’s still a good measuring stick because it accounts for income and age.
3. Net Worth by Age
This chart comes from the Federal Reserve Bulletin’s Survey of Consumer Finances from 2019 [PDF]:
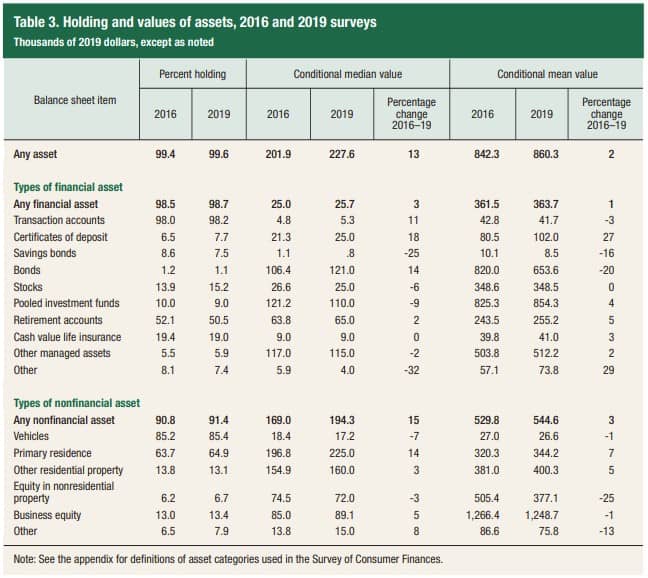
If you want to know how you’re doing compared to your peers, it’s on the chart!
| Age of Householder | Median Net Worth |
|---|---|
| Under 35 years old: | $22,000 |
| 35 to 44 years old: | $97,740 |
| 45 to 54 years old: | $166,600 |
| 55 to 64 years old: | $230,900 |
| 65 to 69 years old: | $285,100 |
| 70 to 74 years old: | $326,700 |
| 65+ years old: | $300,000 |
| 75+ years old: | $292,800 |
The ranges are very wide, a lot can happen in 9 year range, but they give you an idea of where the population is.
4. Average Savings Rate
If your net worth is equal to assets minus liabilities, assets play a pretty big role, right? How do you get those assets up without incurring liabilities? Saving money!
The average savings rate of Americans, according to the Federal Reserve Bank of St. Louis, is around 5.5% at the time of the original publication in March 2017 (it’s since risen to 7.0% in early late 2019, early 2020 – but it spiked during the pandemic). That means for every $100 earned, only $5.50 goes towards things like a savings account, retirement accounts, etc. This is a pre-tax figure, so savings is income minus “outlays” (expenses) and taxes.
Of course, how much you make matters too. The more you make, the more you save…. right? Generally, but not necessarily.
From the Report on the Economic Well-Being of U.S. Households in 2015:
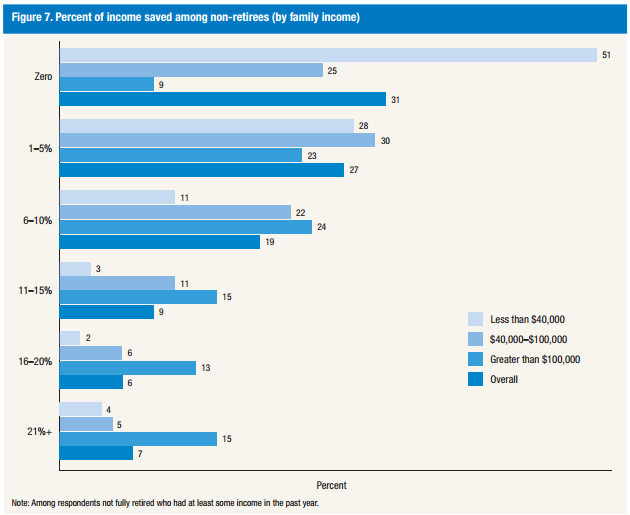
To recap – the average is 5.5% but you should adjust for income too. 31% of all respondents saved 0% and 27% of all respondents saved between 1-5%, but that leaves 41% savings 6%+.
Then, plug that into the average savings balance of Americans, and you have a situation where the median balance needs to get much higher if we want to be in a stable financial situation.
5. F.T.I.- F&*% This Index
I first saw this equation on Quora and I love it for it’s simplicity. I also like how it gives you a finish line.

When your FTI > 1,000 – tell your boss to … pound sand.
He retired with an FI of 1435 – at the age of 41 with a net worth 35 times his expenses. You are financially ready to retire when your FTI is over 1,000 so he had plenty of breathing room.
At it’s core, it’s an expenses driven ratio with a nod towards your mortality, represented by your age.
This only applies to the money side of readiness. If you enjoy your job, it’s low stress, it’s not a bad way to live to keep working. I like to work because I enjoy learning, being productive, and growing through challenges. Removing the financial stress and pressure makes it all the more enjoyable.
Just because you can retire doesn’t mean you must retire.
It’s also a more conservative “FU number” figure than the 4% safe withdrawal rule (which is arguably not all that safe anyway).


Making Your Money Matter says
I’m especially intrigued by the saving rate chart, specifically the fact that the number of people saving 21%+ is low enough that they stop there with the graph. Those are mostly work 9-5 until you die savings rates! Yikes!
The Simple Dollar has a great adjusted formula based on the one from The Millionaire Next Door. It’s worth checking out, as it makes some adjustments for those that are in younger stages where they may have student loan debt and a lower income.
I haven’t looked at some of these for myself in a while-this is a good reminder!
Troy @ Market History says
I think some people miscalculate how much they need to retire. CNBC was mentioning this young entrepreneur who, after selling his business for $1 million at 32, decided to retire and travel the world. The guy probably has at least 40something years left of his life, so $1 million is far from enough.
Anyone can retire… it’s much harder to stay retired. 🙂
Ten Factorial Rocks says
Interesting post Jim. By your Metric #5 (hadn’t seen that before), my FTI ratio is over 3,000. It’s yet another milestone but as you rightly say, just because you can retire doesn’t mean you must.
Doug Massey says
I’d say that an FTI of 3000 means you’re definitely financially independent now — you can continue to work if you wish, but you certainly don’t need to do so anymore. Congratulations!
Doug Massey (inventor of the FTI formula)
Doug! Glad to see you on my little blog – big fan of your FTI.
Lazy Man and Money says
I hadn’t come across many of these so it was fun to read about them. Some of them seem like they were pulled out of a hat, and I can’t believe they really work.
I have difficulty with any formula that takes in expenses. That may sound very weird because expenses are important. However, hear out our personal example.
With sons age 3 and 4 we have some fair high daycare expenses. Those will go away when they become old enough for public school. Additionally, we have about 10 years of mortgage left on our primary residence… our single biggest expense. That will go away as well. So there are life moments when our biggest expenses drastically drop.
I don’t think I’ve read anything that says something like, “Your expected average expenses over the next 25 years” or something like that which would smooth the curve on the graph. (Even then, figuring out expenses with college costs and healthcare can be all over the map depending on any number of unknowns.)
So to take the Massey for example, our number is somewhere between 600, but jumps to 1600 in a couple of years. If we could use cashflow like my wife’s military pension to offset expenses, it might infinite as the denominator gets to zero.
It’s still fun to run the numbers because I enjoy math. I’m just not going to let the results change my life’s plans :-).
Well, you have to take those expenses disappearing (and new ones taking their place) into account – otherwise how will you project into the future? It needs to have some basis in reality, not necessarily reality today. The smoothing out is implicit though, or at least you should be smoothing it out whenever you project your expenses.
Doug Massey says
If you have college costs at some point in the fairly near future, I would estimate that number and then subtract it from your current net worth before using it in my FTI calculation. Just set it aside and assume it’s gone forever (ouch!). 🙂
And if you have a pension payment that is greater than your expenses, then yeah, you’re good to go! If it’d a defined benefit that doesn’t increase with inflation, though, it’s likely that your expenses will continue to increase and might not be covered by that pension at some point in the future. You might consider counting the pension as net worth in the FTI (multiply the yearly pension payment by 25 or 30 to get an estimate of its value), rather than using it to lower the Yearly Expenses portion of the formula — that’d give you a different estimate that won’t go to infinity. 🙂
You’re right about healthcare being a big variable, especially in the US — that’s why I always say that the FTI is just a rule of thumb.
Richard Pomerantz says
I better not show my wife this article or she’s going to want to quit her job today.
I won’t tell if you won’t!
Hoping to retire soon... says
Hi Jim, thanks for this post. I followed you over here from Sam’s blog after seeing your comment about that $500K couple having a rough time managing to get by.
This might seem like a fundamental question, but what assets besides home value, cash, and accessible investments should be part of net worth? For example, do current 401(k) balances count in the asset mix, even though I can’t touch them for 15 years? Does the annual estimated value of a pension go in, even though I similarly can’t access it yet? Or should only current liquid (or liquefiable) assets count?
Thanks!
I add it all in – but I also calculate a “liquid net worth” where I discount them to “cash value today.” So, a 401k you can touch, but you pay taxes and a 10% penalty so I discount them heavily.
The pension part is trickier and I would not include it. I’ve seen calculations where you treat the pension as if it were a safe withdrawal rate investment so divided the pension amount by 0.04 (so it’s 4%). The key is making it so the number is useful to you.
Hoping to retire soon... says
Thanks, makes perfect sense all around, and the discount guidelines you applied in your “LNW” post for the various asset classes are very helpful. For my situation I’m discounting the 401(k)s more deeply at 33+10% (assuming the Congress gets the 39.6 and 35 brackets killed).
Now the hard part I’ve got to figure out on my own. What do I want my “expense” denominator in retirement to be….
Syed says
Lots of great info here. The biggest takeaway for me is to compare yourself to yourself. Everyone has different situations (rich parents, rough childhood in a rough neighborhood) so comparing one on one is a useless exercise. Focus on increasing that net worth, and for most people the best way is to get rid of debt. Getting rid of the debt increases the net worth anyway, and then the newfound money can be put towards asset producing. It’s a wonderful thing when your money starts working for you.
Vin McMahon says
JIM,
In the FTI formula, should you subtract social security benefits from yearly expenses?
To me that makes sense, since your expenses are reduced by that amount.
Vin McMahon
Hmmm… I think that makes sense.
Chad says
The F.T.I is an interesting concept I’m working into my tracker, and I also have a pension to take into account. Does it seem reasonable when using the formula that you would subtract your annual pension amount from the annual expenses?
Age X Net Worth / (Annual Expenses – Annual Pension)
Bob says
I like this formula, but want to know if this applies to joint married couple, or on an individual basis. My wife and I have completely combined assets and should we be using >1000 for our joint F.T.I or should we simply 1/2 our net worth to make it more reasonable.
I think the denominator of yearly expenses would apply to one or more individuals and then you’d just average the age? It’s a rule of thumb so I wouldn’t get too precise with it though.
Jabadu says
It’s critical to distinguish between net worth comprised of liquid/readily available investments/cash, and net worth inclusive of retirement accounts & home equity/fully paid home. For example, i could have a net worth of $2M at the age of 45. But that’s $200k in liquid investments/cash readily available, $1.4M in retirement accounts not available for penalty free withdrawal until 59 1/2, and home equity/fully paid off home at $400k. That’s $2m net worth at 45 years of age. If my expenses were modest at $45k a year, I’d blow through the $200k in 5-6 years. Then at the age of 50 I’d have to start tapping into my retirement accounts which I’d get hit for a 10% penalty for withdrawal under age 59 1/2, plus the impact of taxes on the withdrawals (assuming it’s not a Roth), which would rob from future compounding. Important to consider, and any novice financial planner would point that out in 30 seconds.