Ever wonder how the richest Americans make their money?
We are fascinated with how others make money.
Today is your lucky day because all this information is publicly available. And you probably can guess who the source is.
The Internal Revenue Service. They know (mostly) how much everyone makes, how they make it, and if they don’t believe the person… they dig and find out the real truth. It might surprise you to learn that most rich people are like regular people. They pay taxes and they report their income.
This means that every year the IRS produces a Statistics of Income Bulletin for a previous year. In 2017, that report was for the tax year 2014 and it has some gems.
The report that really catches my eye is the “High-Income Tax Returns, Tax Year 2014.”
For example, did you know that in TY2014, there were 6.3 million individual returns (4.2% of total) where the taxpayer earned more than $200,000? When the median income is $56,516 (2015), it really brings that two hundred grand into focus. That’s some high income.
I love data. If you do too, get yourself a cup of tea or coffee because we’re going to dig in.
Table of Contents
How High Income Taxpayers Earn Money
I’d argue that high-income taxpayers come in all shapes and sizes. You can probably think of a few popular archetypes already – partners at law firms, hedge fund managers, venture capitalist, surgeons, CEOs, and the like.
If you think about it, the only similarity they share is how they make a lot of money. Their industries are different. Their workday looks different. Their social standings are different.
A venture capitalist makes money by placing bets on companies and hoping they do well. They are rarely vilified in the media because they are putting their money (or investors) into startups who can change the world. Hedge fund managers, from time to time, get a little more hate even though functionally they do similar things (invest).
Surgeons make money by performing surgeries that save or change lives for the better. They earn a high income because they have a very specialized, very high demand, very risky skill. They also need many years of schooling and practice before they can think about earning that high income.
So every high-income taxpayer is very different… but if you were to make a Frankenstein-like High Income Earner based on the averages of each category, this is what that person would look like (IRS considers incomes of over $200,000 to be high earners):
- Salary & wages: $306,000
- Business: $78,000
- Farm: $52,000
- Partnership/Corporation: $233,000
- Capital Gains/Losses: $192,000
- Property Sales (not capital): $48,000
- Taxable interest: $11,000
- Tax-exempt interest: $24
- Dividends: $37,000 ($31,000 qualified)
- Pensions: $54,000
- Rent: $42,000
- Royalty: $47,000
This Frankenstein High Income Earner is doing quite well!
In reality, this Frankenstein doesn’t exist. The average high-income earner does not have a business, a W-2 job, as well as pension, rent and royalty income. They may have a little of each, like some qualified dividends from stock holdings, a property sale, plus a business or a salary – but not everything at this percentage. It’s often said millionaires have seven streams of income.
What this does do is catch different people at different high-income events. Some are regularly occurring, like income, dividends, and rent; while others tend to be irregular bursts like property sales.
Where The Rich Make Their Money – Business
The IRS offers a good look into where people make money but it tells an incomplete picture. We only know about realized gains and with such a large population, there are enough of those realized events to draw a broad conclusion. We also don’t know a lot about the net worth of family.
Fortunately, there is better data from the Federal Reserve’s Survey of Consumer Finances. I love this survey!
From the 2016 survey, here is the breakdown of income based on the percentile of net worth:
| Percentile of net worth | |||||
|---|---|---|---|---|---|
| 0-25 | 25-49.9 | 50-74.9 | 75-89.9 | 90-100 | |
| Wages
| 76.4 | 79.4 | 70.2 | 64.9 | 47.1 |
| Interest/dividends | † | .1 | .4 | 1.2 | 7 |
| Business, farm, self-employment | 2.7 | 3.8 | 6.6 | 8.2 | 23.3 |
| Capital gains | * | .2 | .3 | 1.9 | 11.5 |
| Social security/retirement | 11.7 | 12.7 | 19 | 21.7 | 8.6 |
| Transfers or other | 9.1 | 3.8 | 3.5 | 2.1 | 2.5 |
† means less than 0.05%
* Ten or fewer observations in any of the types of income.
As you can see, the highest 10% of Americans by net worth have a sizable percentage of their income come from a business, farm, or through self-employment (which is again a business).
Additionally, we see a high percentage of income from interest/dividends and capital gains. Only 47.1% of their income comes from wages, which is also probably from their business too but just structured as wages.
Want to see something really fascinating? This isn’t that much different than the numbers from 1989:
| Source of income | Percentile of net worth | ||||
|---|---|---|---|---|---|
| 0-25 | 25-49.9 | 50-74.9 | 75-89.9 | 90-100 | |
| Wages
| 78.6 | 82.0 | 76.3 | 72.3 | 44.2 |
| Interest/dividends | .1 | 1.5 | 2 | 4.8 | 14.1 |
| Business, farm, self-employment
| 1.6 | 3.5 | 3.5 | 9.1 | 23.0 |
| Capital gains | * | .4 | 1.9 | 2.6 | 12.3 |
| Social security/retirement | 7.8 | 9.0 | 11.1 | 9.5 | 5.2 |
| Transfers or other | 11.7 | 3.6 | 5.1 | 1.8 | 1.2 |
The biggest difference is interest/dividends and Social Security/retirement were much a higher percentage of everyone’s income in 1989.
We get at this most directly when we look at the percentage of households with business equity:
- 0-25 (percentile of net worth): 2.4% hold business equity
- 25–49.9: 6.2%
- 50–74.9: 13.6%
- 75–89.9: 20.3%
- 90–100: 43.9%
The median value of the asset (for those families that hold the asset) is also enlightening:
- 0-25 (percentile of net worth): $2,000 of business equity
- 25–49.9: $10,000
- 50–74.9: $30,500
- 75–89.9: $100,000
- 90–100: $700,000
High Earner’s Portfolio is $1.89 million
The IRS only knows about income if it is being reported.
The IRS won’t know about a taxpayer’s total net worth or their portfolio of holdings.
But we can make a guess!
Let’s say someone has $31,000 of qualified dividends each year and held only a total market index fund (say, the Vanguard Total Stock Market Index Fund). That fund has a dividend yield of 1.64%, which implies a portfolio of $1.89 million.
A nice nest egg!
What The Wealthy Own
We can also approach this problem from a different direction and a different dataset.
And since 1989, the Federal Reserve produces a Distributional Financial Accounts report every quarter that measures the distribution of household wealth. It’s a marriage of the Financial Accounts of the United States and the Survey of Consumer Finances (SCF).
From 1989 to 2018, the top 1% of wealth in the United States saw their net worth increase by 650%.
The bottom 50% saw an increase of “only” 170%.
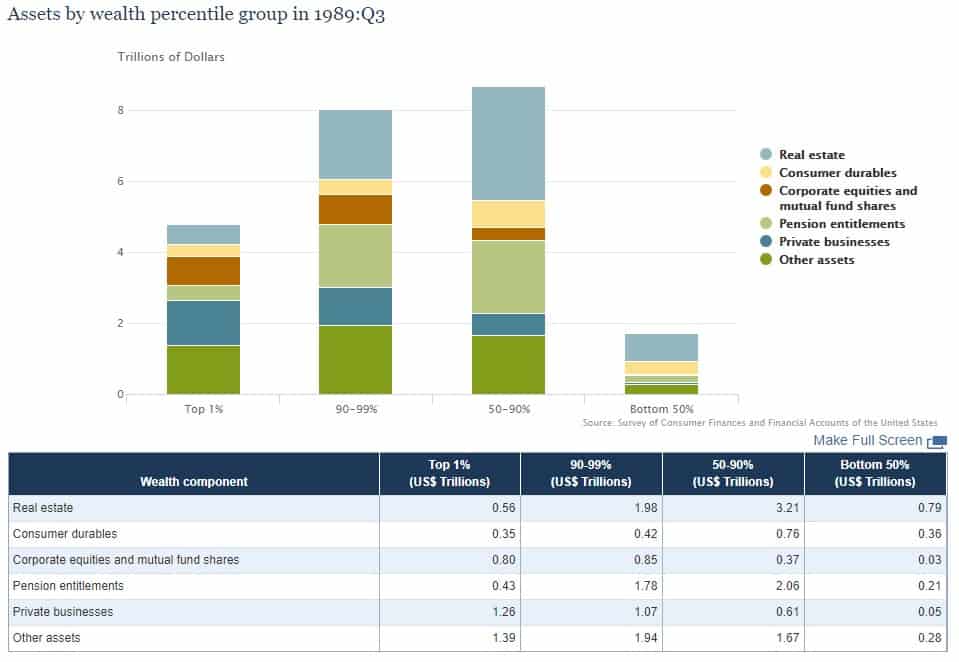
This is what each group owned in 1989:
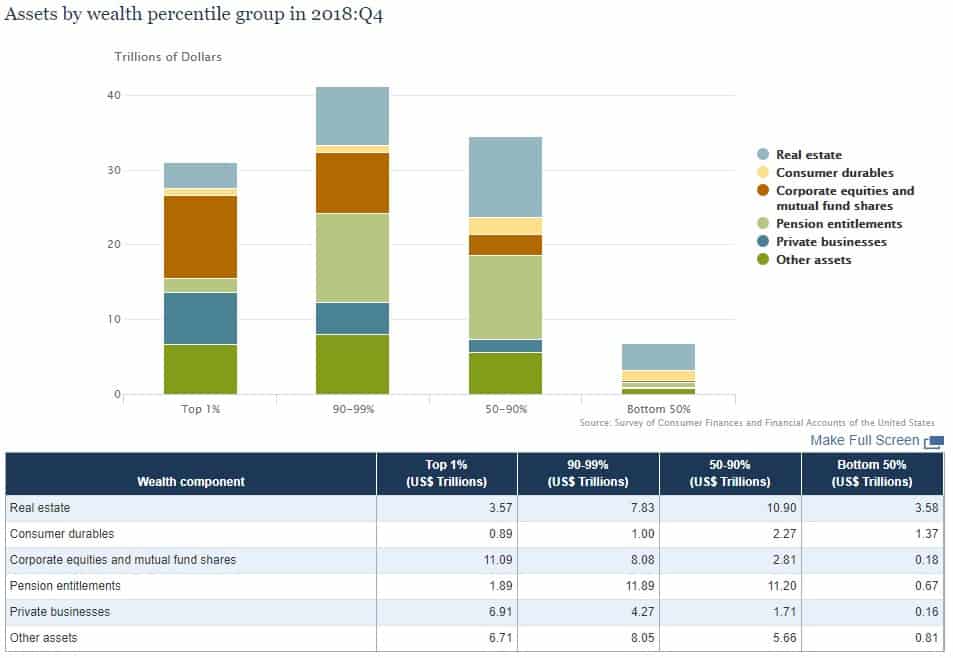
And this is what each group owned in 2018:
Both charts are in trillions of dollars, though the Y-axis labels are different.
The total amounts give you an idea of how the total wealth has shifted around. It’s indisputable that the bottom 50% have been left behind. (one big reason is stock ownership)
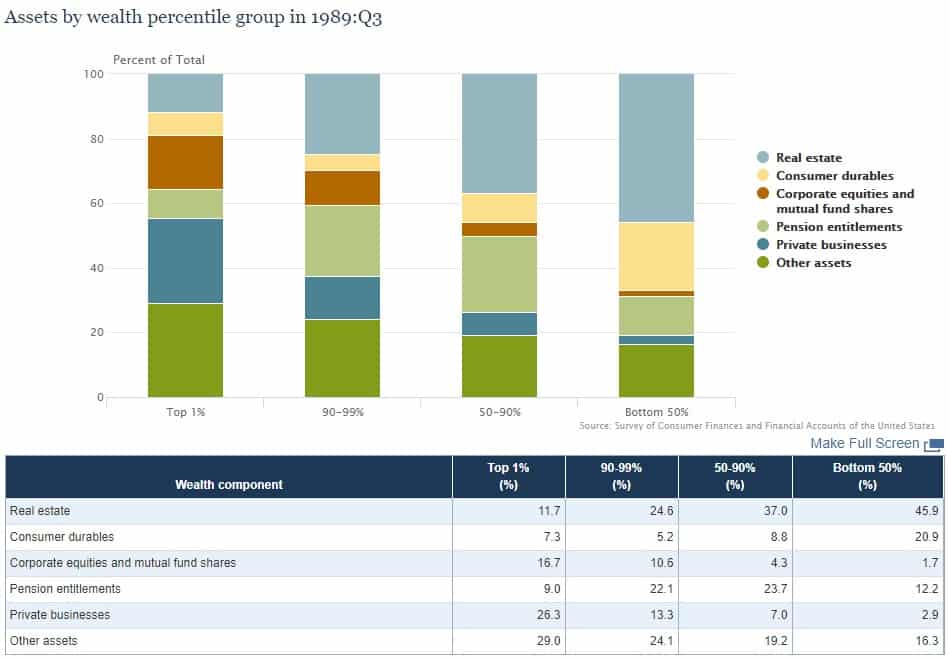
But the fascinating chart is this one, which shows the percentage of wealth components (your stuff) for each category, here in 1989:
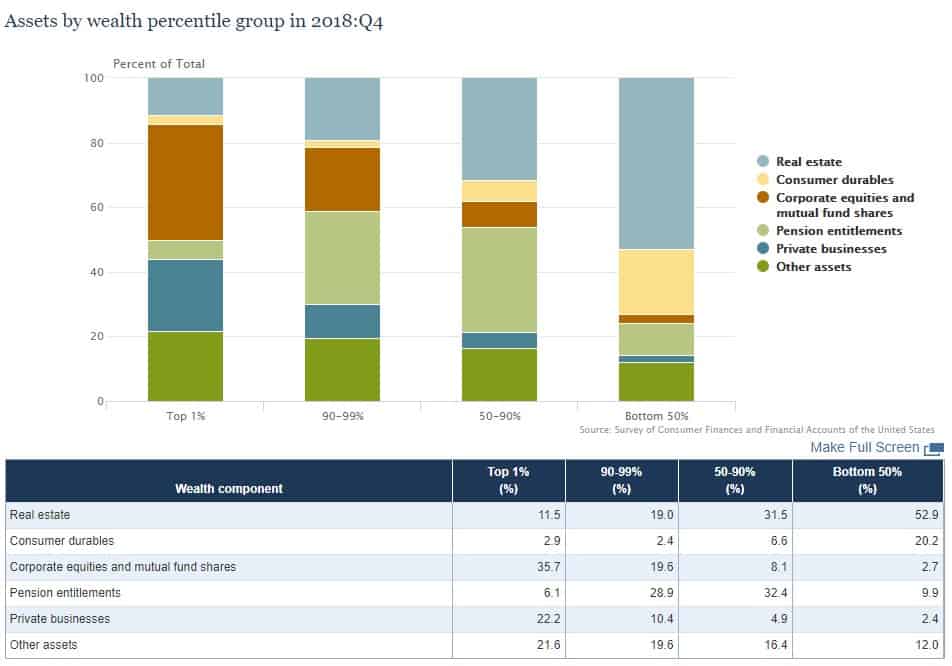
And then in 2018:
One thing we know from studying the data from the U.S. Census on net worth is that a lot of American’s net worth is tied up in their home equity. We see this in the data from this report too because in 1989 the bottom 50% had 45.9% of their wealth in real estate (their home). In 2018, that number increased to 52.9%.
As for the top 1%, the percentage is 11.7% in 1989 and 11.5% in 2018. That said, I’d imagine that some of that in investment property because one can only own so many homes they live in.
Assets are truly what separates the wealthy from the rich.
That’s some fun data to chew on when you have the time!
My Takeaways
I have a couple takeaways:
1. High earners have a lot of different income sources. You need to earn more, save more, and invest the difference. Then reinvest the gains. Rinse, repeat. And the richer they are, the less of their income comes from their wages. The top 10% (90-100 percentile) had only 47.1% of their total income from wages.
2. The wealthy own a lot of stuff but a lot of that stuff appreciates. And that’s key. If you want to see your wealth grow, it needs to be in assets that appreciate significantly. Real estate can do that if you are good at picking properties but as a whole industry, it’s not a great investment, you’ll want to go with the stock market.
What did you think of this data?


Leave a Comment: